Bullish sentiment with ADA/USD is at a fever pitch. Buoyed by broad upward momentum across crypto and exuberance from ADA news this week, the bulls are firmly in control and bearish forecasts are invalidated. This week's monster 40% jump from 1.00 paused around 1.20-1.25 before jumping to 1.43. Since then prices remain in the upper 1.30's trying to collect energy to take another run at the 1.44 fib. It remains to be seen how much higher we can go, as we are now up 1000% in two and a half months.
Short-term (intraday) - Another run at 1.44 possible, with risk of partial retracement
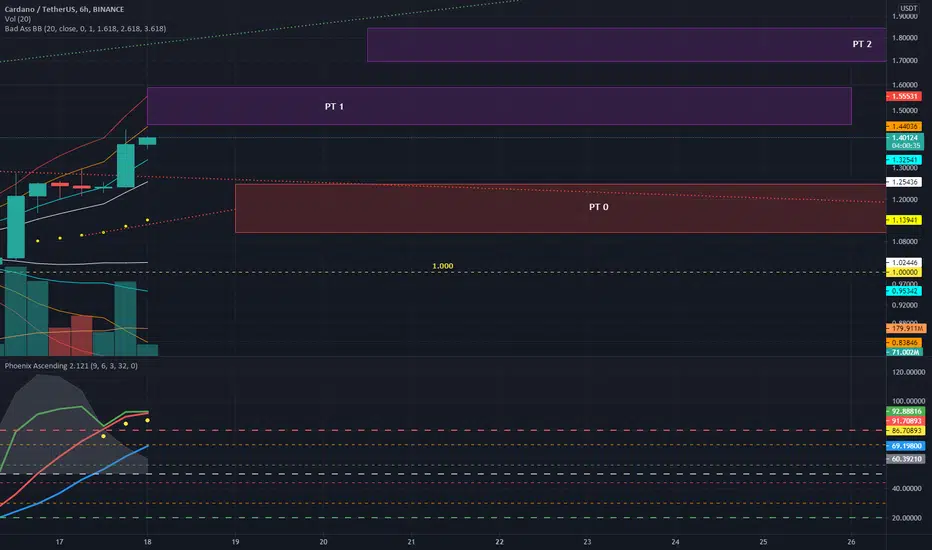
TA indicators in intraday timeframes are showing a general cooling of upward momentum, which is to be expected after a 40% spike. Prices look to stay in the upper B-bands (upper aqua to upper orange) with another run at the 1.44 fib (Price Target 1) possible. If broken, a possible test of the 1.53 fib (Price Target 2 - an area of significant resistance). If 1.44 cannot be broken, retracement would bring us back down to the 1.25 region (Price Target 0) before going up again.
Near-term (1-4 day) - Tests of 1.44 and 1.53, with risk of partial retracement
1 day chart indicators are suggesting that upward momentum may soon be at a top in today's candle, though RSI and LSMA are soon to cross above level 50. In tomorrow's daily candle we could see expanding B-bands opening up the possibility of higher highs in coming days, such as a test of 1.53 fib. In the 3D and 4D, the descent of the RSI and LSMA look to be flattening out, which would allow for more upward movement with sufficient momentum. If 1.44 is broken, we can expect strong resistance around the 1.53 fib, but if broken 1.83 would be the next target.

Mid-term (5 day to 2 week) - Limited potential to sustain higher ATH's, growing potential for correction in coming weeks
Despite the spike in prices, the 5D chart is still showing downward pressure for the rest of this month and first week of April. In fact, the large gap between the green EMA and white EMA shows a significant and ongoing risk of a correction. The 1 week chart shows this even more clearly with the lagging LSMA flat and all other indicators trending down in the current weekly candle despite current upward price action and momentum. The next weekly candle in 4 days should reveal if downward momentum is/will be reversing. Until then, the downward pressure will cap highs. As sunny as the short-term looks right now, one must not overlook the distinct possibility of a significant retracement again towards 1.00 the next few weeks.

Longer term (Weeks/Months)
ADA continues to look quite bullish for the remainder of the year until we hit the peak of this buying cycle.
Short-term (intraday) - Another run at 1.44 possible, with risk of partial retracement
TA indicators in intraday timeframes are showing a general cooling of upward momentum, which is to be expected after a 40% spike. Prices look to stay in the upper B-bands (upper aqua to upper orange) with another run at the 1.44 fib (Price Target 1) possible. If broken, a possible test of the 1.53 fib (Price Target 2 - an area of significant resistance). If 1.44 cannot be broken, retracement would bring us back down to the 1.25 region (Price Target 0) before going up again.
Near-term (1-4 day) - Tests of 1.44 and 1.53, with risk of partial retracement
1 day chart indicators are suggesting that upward momentum may soon be at a top in today's candle, though RSI and LSMA are soon to cross above level 50. In tomorrow's daily candle we could see expanding B-bands opening up the possibility of higher highs in coming days, such as a test of 1.53 fib. In the 3D and 4D, the descent of the RSI and LSMA look to be flattening out, which would allow for more upward movement with sufficient momentum. If 1.44 is broken, we can expect strong resistance around the 1.53 fib, but if broken 1.83 would be the next target.
Mid-term (5 day to 2 week) - Limited potential to sustain higher ATH's, growing potential for correction in coming weeks
Despite the spike in prices, the 5D chart is still showing downward pressure for the rest of this month and first week of April. In fact, the large gap between the green EMA and white EMA shows a significant and ongoing risk of a correction. The 1 week chart shows this even more clearly with the lagging LSMA flat and all other indicators trending down in the current weekly candle despite current upward price action and momentum. The next weekly candle in 4 days should reveal if downward momentum is/will be reversing. Until then, the downward pressure will cap highs. As sunny as the short-term looks right now, one must not overlook the distinct possibility of a significant retracement again towards 1.00 the next few weeks.
Longer term (Weeks/Months)
ADA continues to look quite bullish for the remainder of the year until we hit the peak of this buying cycle.
Note
Update: As forecast, ADA did hit 1.44, and wicked to 1.47, but could not find support above 1.44 in the P1 price target area. Since then we have fallen to the P0 price target around 1.25. There is support both at 1.25 and 1.20, but the 6H chart is indicating that we might go to the basis (around 1.17) if we do not see a reversal. With the new daily chart in 4 hours we see where prices go next.Disclaimer
The information and publications are not meant to be, and do not constitute, financial, investment, trading, or other types of advice or recommendations supplied or endorsed by TradingView. Read more in the Terms of Use.
Disclaimer
The information and publications are not meant to be, and do not constitute, financial, investment, trading, or other types of advice or recommendations supplied or endorsed by TradingView. Read more in the Terms of Use.