Hello traders!
Please take a minute to leave a like and follow this channel now for regular day trade and swing trade setups for the top 20 cryptos! Our trade setups are well over 80% green and our last ADA/USDT short hit target 4/5 for a 59.86% gain within 32 hours!
Hope everyone is having a great weekend! Albeit BTC has been relatively quiet, there have been so many other setup in the cryptosphere!
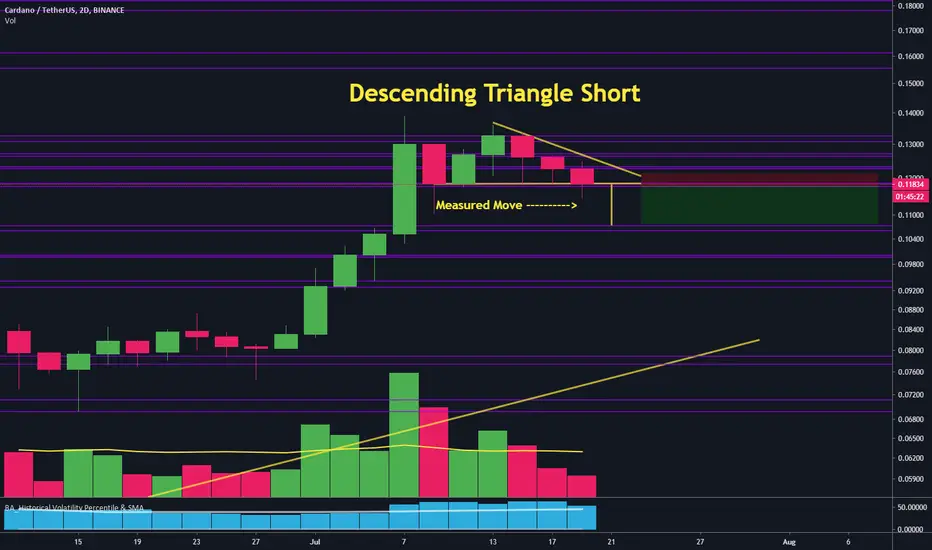
Here we can see ADA/USDT forming a descending triangle on the 2D chart. The measured move for the breakdown has strong confluence with daily vertical support and a key Fibonacci target.
If the bottom side of the descending triangle is closed below, that may lead to a downtrend on the daily time frame. Currently, we are seeing a down trend on up to the 10H chart, but nothing higher time frame.
The daily 10SMA is also acting as resistance. We have not closed a daily candle above it for the last few days and we just bounced off the daily 21EMA.
I'm looking for a candle closure below the bottom of the descending triangle for an entry. I will be watching the 2H, 4H, 12H, and 24H candle closes for an entry. A higher time frame candle typically equates to a higher probability of this trade working out; however, a smaller time frame candle with abnormal volume may also warrant an entry.
To be prepared for this setup, I am setting an alert in Tradingview. If the alert goes off, then I'll watch key an eye out for an entry!
---
Entry: 0.11843
Entry Zone: 0.12017 - 0.11550
T1: 0.11515
T2: 0.11370
T3: 0.11210
T4: 0.11075
T5: 0.10776
Stop: 0.12115
--
R:R: 3.05
Risk: 2.81%
Reward: 8.55%
Leverage: 8X
Leveraged Risk: 22.48%
Leveraged Reward: 68.4%
===
This is not financial advice; I am not a financial adviser. This information is not meant to be used for financial advice, nor trade ideas. These posts are simply a record of my trade ideas and are intended for educational purposes only.
Please take a minute to leave a like and follow this channel now for regular day trade and swing trade setups for the top 20 cryptos! Our trade setups are well over 80% green and our last ADA/USDT short hit target 4/5 for a 59.86% gain within 32 hours!
Hope everyone is having a great weekend! Albeit BTC has been relatively quiet, there have been so many other setup in the cryptosphere!
Here we can see ADA/USDT forming a descending triangle on the 2D chart. The measured move for the breakdown has strong confluence with daily vertical support and a key Fibonacci target.
If the bottom side of the descending triangle is closed below, that may lead to a downtrend on the daily time frame. Currently, we are seeing a down trend on up to the 10H chart, but nothing higher time frame.
The daily 10SMA is also acting as resistance. We have not closed a daily candle above it for the last few days and we just bounced off the daily 21EMA.
I'm looking for a candle closure below the bottom of the descending triangle for an entry. I will be watching the 2H, 4H, 12H, and 24H candle closes for an entry. A higher time frame candle typically equates to a higher probability of this trade working out; however, a smaller time frame candle with abnormal volume may also warrant an entry.
To be prepared for this setup, I am setting an alert in Tradingview. If the alert goes off, then I'll watch key an eye out for an entry!
---
Entry: 0.11843
Entry Zone: 0.12017 - 0.11550
T1: 0.11515
T2: 0.11370
T3: 0.11210
T4: 0.11075
T5: 0.10776
Stop: 0.12115
--
R:R: 3.05
Risk: 2.81%
Reward: 8.55%
Leverage: 8X
Leveraged Risk: 22.48%
Leveraged Reward: 68.4%
===
This is not financial advice; I am not a financial adviser. This information is not meant to be used for financial advice, nor trade ideas. These posts are simply a record of my trade ideas and are intended for educational purposes only.
Note
Price had not closed below the light blue 12H 21EMA for the duration of this bull run, but we may be closing the 1st one below it after this closure. If we continue to close below the 12H 21EMA (light blue line), then we will have a cross of the 12H red 10SMA and the 21EMA. This could signal increased strength to the downside.
Note
We see ADA has not been able to close a daily candle above the red 10SMA for the past three days and just today dropped down to test the indigo 21EMA.Note
Price has not closed below the light blue 12H 21EMA for the duration of this bull run, but we may be closing the 1st one below it after this closure. If we continue to close below the 12H 21EMA (light blue line), then we will have a cross of the 12H red 10SMA and the 21EMA. This could signal increased strength to the downside.Note
We have our first 4H closure below the green 89EMA and a possible close below the bottom side of the descending triangle. Note
Let's go bears!Note
A safer entry would be upon a breakdown below the red descending price channel. General Inquiries: t.me/cryptoguru369
Twitter: twitter.com/CryptoGuru369
Twitter: twitter.com/CryptoGuru369
Related publications
Disclaimer
The information and publications are not meant to be, and do not constitute, financial, investment, trading, or other types of advice or recommendations supplied or endorsed by TradingView. Read more in the Terms of Use.
General Inquiries: t.me/cryptoguru369
Twitter: twitter.com/CryptoGuru369
Twitter: twitter.com/CryptoGuru369
Related publications
Disclaimer
The information and publications are not meant to be, and do not constitute, financial, investment, trading, or other types of advice or recommendations supplied or endorsed by TradingView. Read more in the Terms of Use.