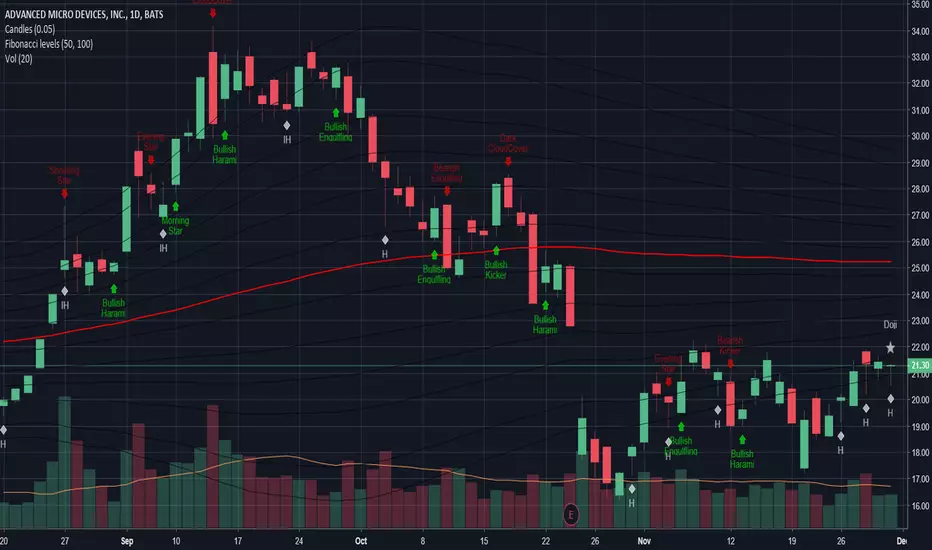
AMD closed on $21.30 on Friday 30/11/2018 - on a volume of 80.9 mil vs a daily average of 109.4 mil with 1.5 mil shares traded after hours.
Key price points
Currently Pivot point sits on $21.06 with the first resistance sitting on $21.38 a break of this will move AMD towards $21.58 $21.90 $22.44 $22.56.
Below the pivot point of $21.06 will be supports at $20.74 $20.54 $20.22 $19.92
Short term AMD is trending up from the low of $16.17 on OCT 30th it is also above the 10 day moving average of $20.23, 20 day moving average of $20.41 and 200 day moving average of $17.83 meaning short term and long term AMD shows a good uptrend with the bulls in power. It is also showing higher lows from Nov 20 from $17.18 showing that the trend may also be reversing to move higher.
However AMD is currently under an important moving average of 50 day which is currently $23.78 if it is able to move past this price point it could return to the high $20 and low $30s by end of year. Failure to move beyond this point can see AMD oscillating between the supports and 50 day moving average making the range wide enough for good opportunity to scalp as well as derivative trading such as options and CFD.
ADX is currently on 18.3 which is below 25 which may indicate a flat trend with DMI+ at 22 and DMI- 23.4 this indicates a flat trend.
I am looking for entries this week below the pivot with the ranges of $20.54-20.74 stop loss will be $19.8 looking to hold to see if it can move above the 50 day moving average of $23.78 to move above.
I am not a professional and these views are only my own opinion please do your due diligence before trading any stocks. Best wishes for the week ahead.
Disclaimer
The information and publications are not meant to be, and do not constitute, financial, investment, trading, or other types of advice or recommendations supplied or endorsed by TradingView. Read more in the Terms of Use.
Disclaimer
The information and publications are not meant to be, and do not constitute, financial, investment, trading, or other types of advice or recommendations supplied or endorsed by TradingView. Read more in the Terms of Use.