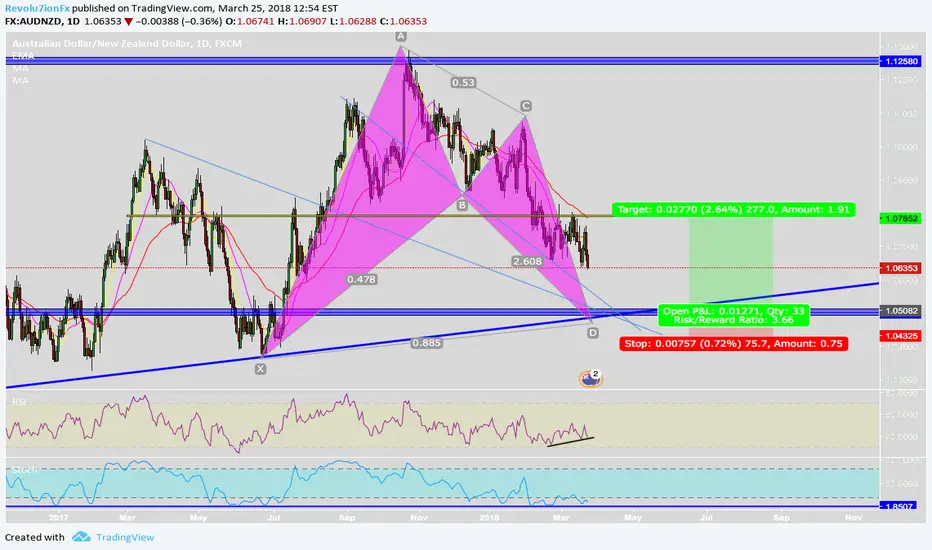
As we can see the area indicated is a MAJOR point of confluence with 1.05000 being a weekly support zone.
Overlapping trendiness from multiple points including one on the weekly time frame
A daily harmonic pattern which is a big indication to expect a bounce from that zone, especially considering the other factors.
And finally, a very oversold market with the stock being around 1.08507.
Follow for more :)
Disclaimer
The information and publications are not meant to be, and do not constitute, financial, investment, trading, or other types of advice or recommendations supplied or endorsed by TradingView. Read more in the Terms of Use.
Disclaimer
The information and publications are not meant to be, and do not constitute, financial, investment, trading, or other types of advice or recommendations supplied or endorsed by TradingView. Read more in the Terms of Use.