📈 AUD/NZD 4H Chart Analysis – Buy Setup
✅ Market Structure:
Pair: AUD/NZD
Timeframe: 4-Hour (H4)
Trend: Bullish
Key points on the chart
🔼 Buy Signal Confirmed:
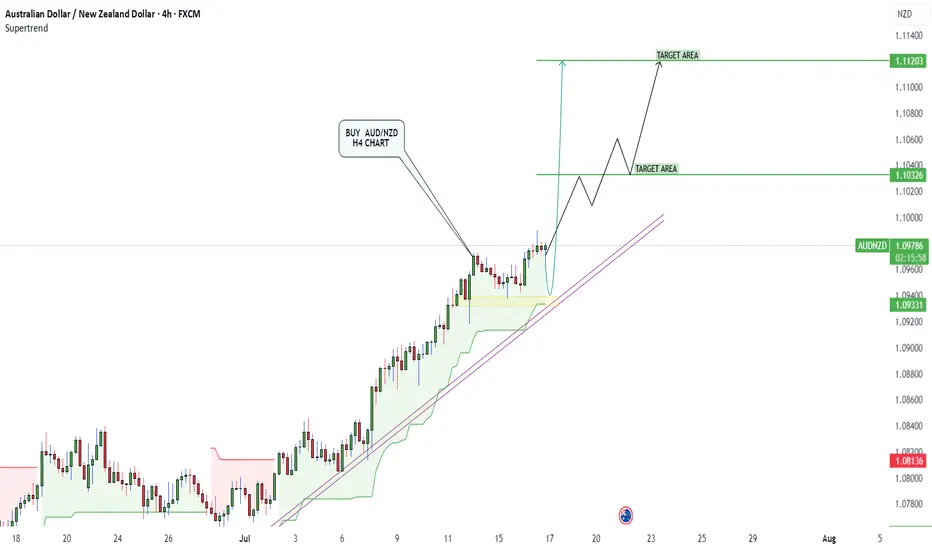
The chart clearly shows a “BUY AUD/NZD H4 CHART” label.
Price is following an upward trendline.
The market is making higher highs and higher lows, a strong bullish structure.
Price is staying above the cloud, adding bullish confirmation.
---
🎯 Target Areas (Take Profits):
1. First Target Area (TP1):
Level: 1.10326
Expected minor resistance zone. Good area for partial profit booking.
2. Second Target Area (TP2):
Level: 1.11120
Major bullish final target if trend continues.
---
🛡️ Support Areas:
Support 1 (Trendline):
Price is bouncing from an ascending trendline acting as dynamic support.
Support 2 (Cloud):
The cloud is providing soft support underneath current price.
Horizontal Support:
Previous breakout level at 1.09331, now acting as support zone.
📌 Trading Plan Summary:
Entry: Already triggered near 1.08136 (as per chart)
SL (Stop Loss): Below trendline or cloud (around 1.0740–1.0760)
TP1: 1.10326
TP2: 1.11120
Let me know if you'd like this chart redrawn digitally or if you want a similar breakdown for any other pair!
✅ Market Structure:
Pair: AUD/NZD
Timeframe: 4-Hour (H4)
Trend: Bullish
Key points on the chart
🔼 Buy Signal Confirmed:
The chart clearly shows a “BUY AUD/NZD H4 CHART” label.
Price is following an upward trendline.
The market is making higher highs and higher lows, a strong bullish structure.
Price is staying above the cloud, adding bullish confirmation.
---
🎯 Target Areas (Take Profits):
1. First Target Area (TP1):
Level: 1.10326
Expected minor resistance zone. Good area for partial profit booking.
2. Second Target Area (TP2):
Level: 1.11120
Major bullish final target if trend continues.
---
🛡️ Support Areas:
Support 1 (Trendline):
Price is bouncing from an ascending trendline acting as dynamic support.
Support 2 (Cloud):
The cloud is providing soft support underneath current price.
Horizontal Support:
Previous breakout level at 1.09331, now acting as support zone.
📌 Trading Plan Summary:
Entry: Already triggered near 1.08136 (as per chart)
SL (Stop Loss): Below trendline or cloud (around 1.0740–1.0760)
TP1: 1.10326
TP2: 1.11120
Let me know if you'd like this chart redrawn digitally or if you want a similar breakdown for any other pair!
Join me On Telegram
t.me/+ljZOrmYoIKg2NTY0
Gold Trading Signals 🚀 99%
t.me/+jn3XFiRWJII3ZDA0
Join My Recommended Broker, Link
👇
World Best Broker Exness ✅
one.exnesstrack.org/a/4xctfcub9x
t.me/+ljZOrmYoIKg2NTY0
Gold Trading Signals 🚀 99%
t.me/+jn3XFiRWJII3ZDA0
Join My Recommended Broker, Link
👇
World Best Broker Exness ✅
one.exnesstrack.org/a/4xctfcub9x
Disclaimer
The information and publications are not meant to be, and do not constitute, financial, investment, trading, or other types of advice or recommendations supplied or endorsed by TradingView. Read more in the Terms of Use.