Description:
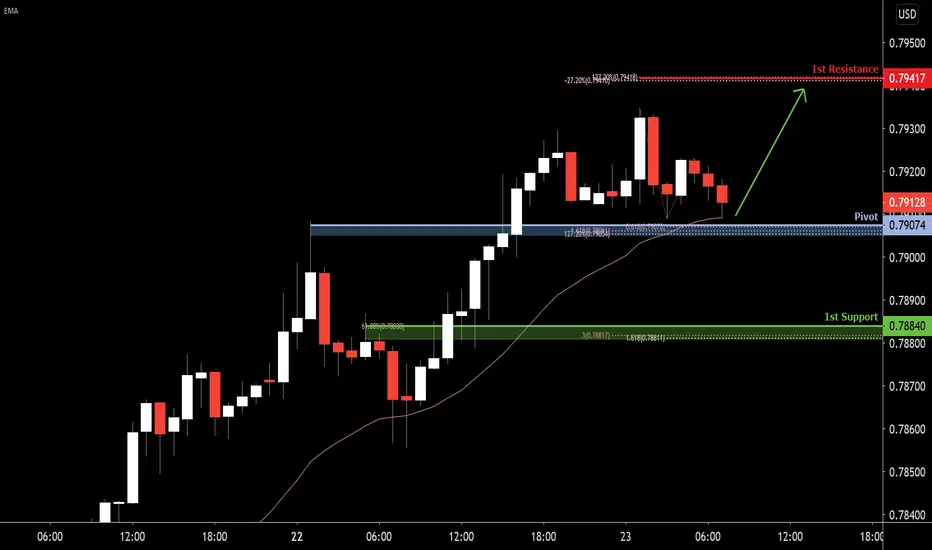
Price is approaching our pivot at 0.79074, in line with 127% fibonacci retracement, 161.8%, 61.8% fibonacci extension, moving average support and horizontal graphical overlap. Where we could see a bounce above this level. Do note that price is trending above the moving average, in line with our bullish analysis.
Pivot: 0.79074
Supporting Points:
127% fibonacci retracement, 161.8%, 61.8% fibonacci extension, moving average support and horizontal graphical overlap
1st Support: 0.78840
Supporting Points:
61.8% Fibonacci retracement, 300% and 161.8% fibonacci extension
1st Resistance: 0.79417
Supporting Points:
-27% and 127% Fibonacci retracement.
Trading FX & CFDs carries high risk.
Disclaimer
The information and publications are not meant to be, and do not constitute, financial, investment, trading, or other types of advice or recommendations supplied or endorsed by TradingView. Read more in the Terms of Use.
Disclaimer
The information and publications are not meant to be, and do not constitute, financial, investment, trading, or other types of advice or recommendations supplied or endorsed by TradingView. Read more in the Terms of Use.