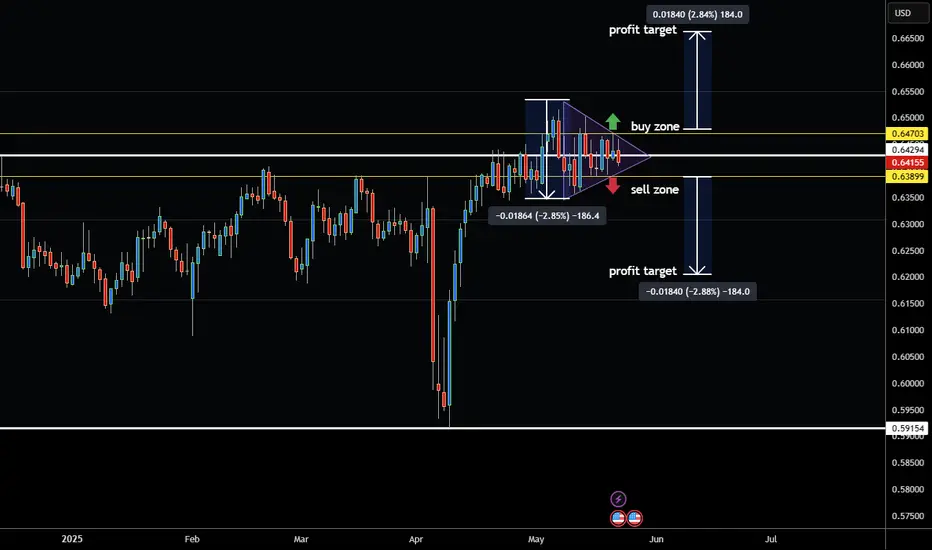
Hey traders so today we are going to look at the Austrailian Dollar which is now in chart pattern called a Symetrical Triangle.
So how do we know which way to trade the market right now?
We don't so why guess when instead we can wait for the market to confirm which way it wants to go.
These are normally known as a consolidation patterns, and normally they can break out in the direction of the prevailing trend which appears to be bullish. However they can also break against the trend so the best way to trade it is watch which side it breaks then place an order to enter on the side that market breaks out of. The the other side can then become your stop loss because most likely the market won't go to the other side.
For profit target you can measure the distance of the triangle from top to bottom so in this example 183 pips or ticks.
Always use Risk Management! (just in case your wrong in your analysis)
Hope This Helps Your Trading
Clifford
Note
Closer look hereTrade active
Here is current updateNote
Current Update so far in this example you would not have been stopped out.Disclaimer
The information and publications are not meant to be, and do not constitute, financial, investment, trading, or other types of advice or recommendations supplied or endorsed by TradingView. Read more in the Terms of Use.
Disclaimer
The information and publications are not meant to be, and do not constitute, financial, investment, trading, or other types of advice or recommendations supplied or endorsed by TradingView. Read more in the Terms of Use.