📅 Current Market Status (as of July 18, 2025)
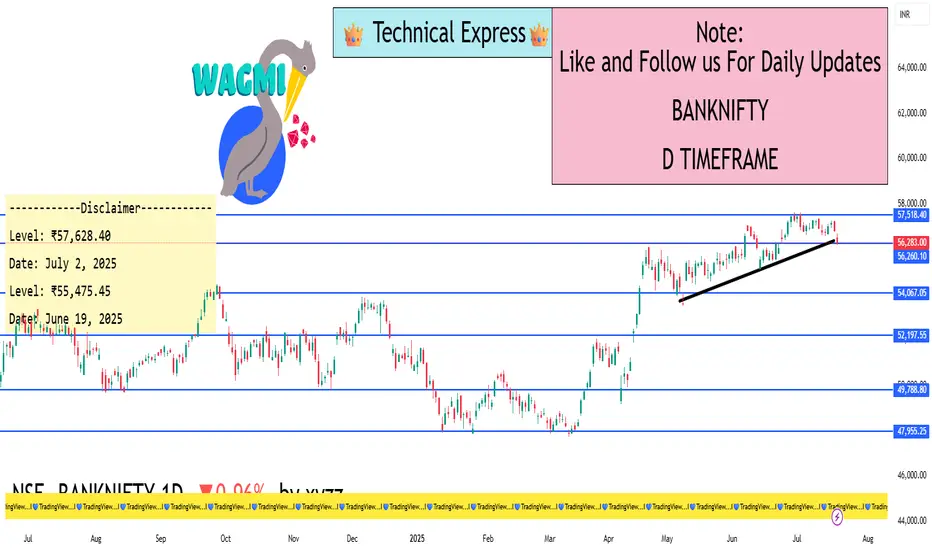
Closing Price: ₹56,283
Fall Today: –547 points (–0.96%)
Intraday Range: ₹56,205 (Low) to ₹56,849 (High)
52-Week Range: ₹43,199 (Low) to ₹57,817 (High)
2025 Performance So Far: Up around 9.5%
🧮 Moving Averages – All Are Negative
From 5-day to 200-day, all moving averages are giving SELL signals.
This confirms a strong downtrend.
Price is below every major moving average → means no strength for recovery yet.
📉 Support and Resistance Levels
Type Price Range
Support ₹55,800 – ₹56,000
Resistance ₹56,700 – ₹57,200
If the price falls below ₹55,800, we may see further fall toward ₹55,000.
For any upward trend to begin, Bank Nifty must close above ₹57,200.
⚠️ Market Mood – What’s Going On?
Strong Downtrend: Bears are in control; market is falling continuously.
High Volume on red candles: Big traders are selling heavily.
Oversold Condition: Market has fallen too much, may bounce a little.
High Volatility: Big movements (500–600+ points) can happen daily.
✅ Easy Summary
Overall Trend: Bearish (Downtrend)
Short-Term Possibility: Small upward bounce may come due to oversold indicators
But: No proper recovery signal until Bank Nifty moves above ₹57,200
Traders should be cautious – trend is still weak and selling pressure is high.
🔮 What to Watch Next?
RSI Above 35: Could be an early sign of recovery.
MACD Crossover: Needed for trend reversal.
Low Red Candle Volume: Means selling may be ending.
₹55,800 Support: If this breaks, further downside likely
Hello Guys ..
WhatsApp link- wa.link/d997q0
Email - techncialexpress@gmail.com ...
Script Coder/Trader//Investor from India. Drop a comment or DM if you have any questions! Let’s grow together!
WhatsApp link- wa.link/d997q0
Email - techncialexpress@gmail.com ...
Script Coder/Trader//Investor from India. Drop a comment or DM if you have any questions! Let’s grow together!
Related publications
Disclaimer
The information and publications are not meant to be, and do not constitute, financial, investment, trading, or other types of advice or recommendations supplied or endorsed by TradingView. Read more in the Terms of Use.