📉 Market Overview
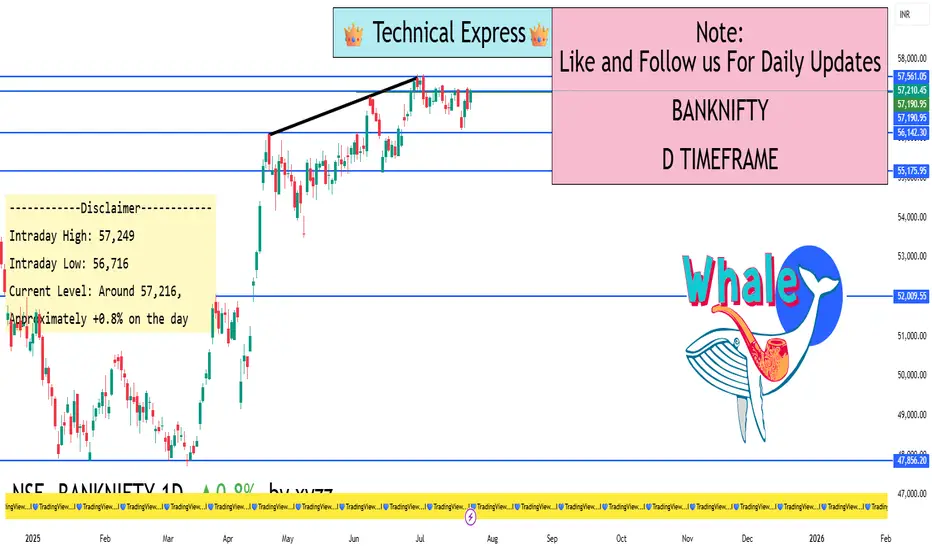
On the daily chart (1D timeframe), Bank Nifty showed signs of weakness today. It opened strong in the morning, moved higher during the first half, but faced selling pressure at higher levels and eventually closed near the day’s low.
This kind of price movement typically indicates short-term bearish sentiment and hesitation among buyers at higher levels.
📌 Key Market Data
Open: Around 57,200
High: Near 57,286
Low: Around 56,692
Close: Approximately 56,756
Net Change: Down by around 0.35% for the day
🔍 Candlestick Pattern
The candle formed today is bearish in nature. It could resemble something like a dark cloud cover or inverted hammer depending on the exact structure. This shows that bulls tried to push prices higher, but bears took over by the end of the session.
This candle near a resistance level usually suggests a reversal or at least a pause in upward momentum.
🔧 Technical Indicators (Daily Chart)
RSI (Relative Strength Index): Around 50–52
This shows a neutral zone — neither overbought nor oversold. It means the index has room to go either way depending on market sentiment.
MACD (Moving Average Convergence Divergence): Slightly positive
The MACD line is still above the signal line, showing some bullish momentum is intact — but it's fading.
Moving Averages:
20-day EMA: Bank Nifty closed below this line, showing short-term weakness.
50-day SMA: Still holding above this line, so the broader trend remains mildly bullish.
📊 Price Action Summary
Bank Nifty failed to break above the 57,300 zone.
Sellers became active at higher levels, pushing the index down.
Closing near the day's low shows bearish pressure is currently dominant.
The index is moving in a range, with no clear trend yet.
📈 What to Watch for Tomorrow
✅ Bullish Scenario:
If Bank Nifty moves above 57,300 with volume, we may see it head toward 57,500–57,800 in the next few days. This would indicate bulls are regaining control.
⚠️ Bearish Scenario:
If it breaks below 56,600, a further drop toward 56,000 is likely. This would be a signal that short-term correction is underway.
🔄 Sideways:
If the price stays between 56,600 and 57,300, the market is consolidating and waiting for a trigger (earnings, global news, RBI policy, etc.)
🎯 Strategy Outlook
Intraday traders: Be cautious near resistance (57,300) and support (56,600). These are zones where reversals happen.
Swing traders: Watch for a clear breakout or breakdown before taking big positions.
Options traders: Expect volatility to rise if it breaks out of the current range.
📌 Conclusion
Bank Nifty on the daily chart is showing signs of indecision and minor weakness. The index is stuck in a tight range, and traders are waiting for a clear breakout above resistance or breakdown below support. Until then, range-bound trading with proper stop-loss is advised.
If you’d like the same type of analysis for Nifty 50, Sensex, or specific stocks like Reliance or HDFC Bank, just ask — I’ll deliver them without links and in the same easy language.
Hello Guys ..
WhatsApp link- wa.link/d997q0
Email - techncialexpress@gmail.com ...
Script Coder/Trader//Investor from India. Drop a comment or DM if you have any questions! Let’s grow together!
WhatsApp link- wa.link/d997q0
Email - techncialexpress@gmail.com ...
Script Coder/Trader//Investor from India. Drop a comment or DM if you have any questions! Let’s grow together!
Related publications
Disclaimer
The information and publications are not meant to be, and do not constitute, financial, investment, trading, or other types of advice or recommendations supplied or endorsed by TradingView. Read more in the Terms of Use.