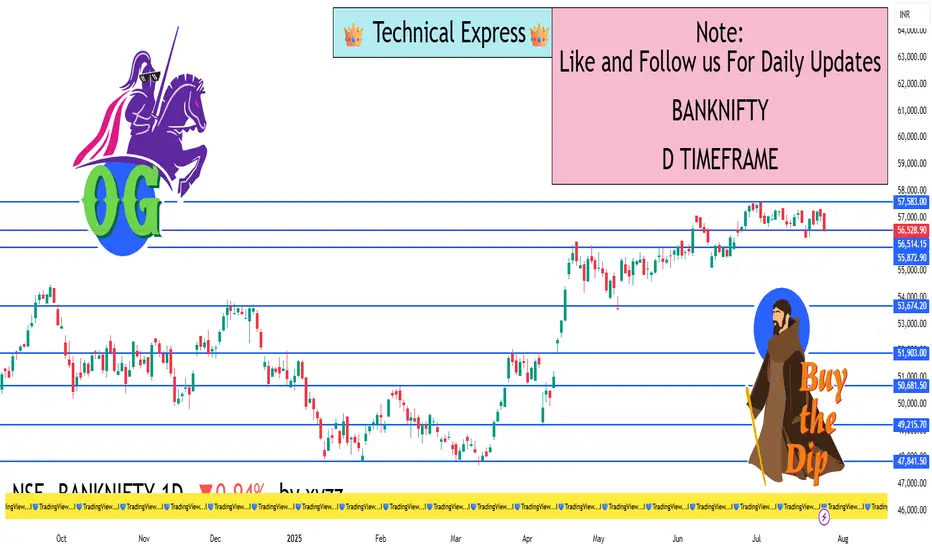
Closing Price: ₹56,528.90
Opening Price: ₹57,113.90
Day High: ₹57,170.70
Day Low: ₹56,439.40
Net Change: –₹537.15 (–0.94%)
🔹 Key Price Levels
📉 Support Zones:
Support 1 (S1): ₹56,255
Support 2 (S2): ₹55,982
Support 3 (S3): ₹55,524
Fibonacci Support Zone: ₹56,260 – ₹56,430
Camarilla Support Levels: ₹56,460 / ₹56,395 / ₹56,328
📈 Resistance Zones:
Resistance 1 (R1): ₹56,987
Resistance 2 (R2): ₹57,444
Resistance 3 (R3): ₹57,718
Fibonacci Resistance Zone: ₹56,992 – ₹57,165
Camarilla Resistance Levels: ₹56,596 / ₹56,663 / ₹56,730
🔸 Pivot Point (Central Level): ₹56,713
🔹 Trend Direction (1-Day Timeframe)
📊 Short-Term Trend: Consolidating with mild bearish pressure.
📉 Price closed below pivot point (₹56,713), signaling short-term weakness.
✅ Still within bullish structure as long as it holds above ₹55,980 – ₹56,000.
🔹 Technical Indicator Snapshot
RSI: Around 58 → Still in bullish territory, but momentum cooling.
MACD: Positive crossover, but histogram flattening — sign of range or pause.
20 EMA: Near ₹57,000 → Price is currently below this level.
50 EMA: Around ₹55,500 → Still acts as major support.
Price Action: Forming inside candles → Indicates compression/indecision.
Hello Guys ..
WhatsApp link- wa.link/d997q0
Email - techncialexpress@gmail.com ...
Script Coder/Trader//Investor from India. Drop a comment or DM if you have any questions! Let’s grow together!
WhatsApp link- wa.link/d997q0
Email - techncialexpress@gmail.com ...
Script Coder/Trader//Investor from India. Drop a comment or DM if you have any questions! Let’s grow together!
Related publications
Disclaimer
The information and publications are not meant to be, and do not constitute, financial, investment, trading, or other types of advice or recommendations supplied or endorsed by TradingView. Read more in the Terms of Use.