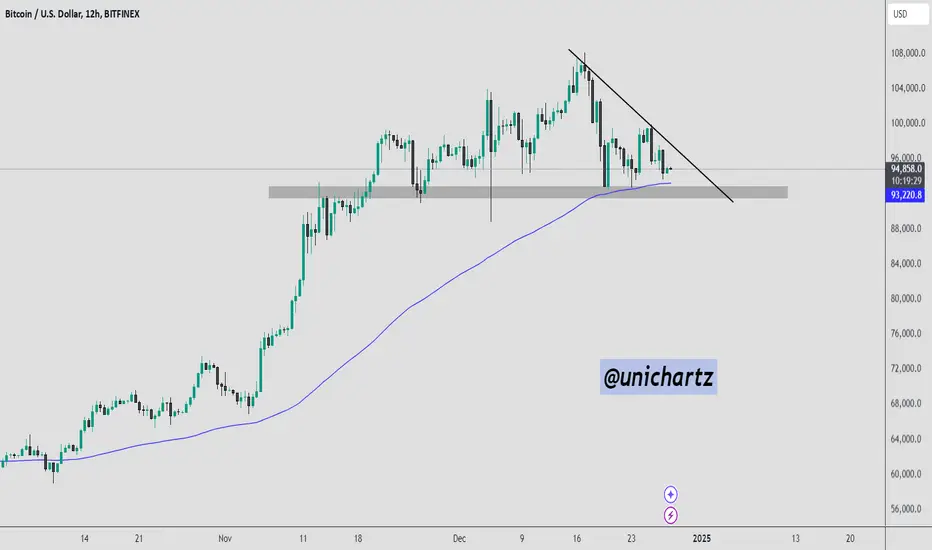
Bitcoin is currently trading near $94,500, resting on a strong confluence of support. The price is testing the 100 EMA on the 12-hour chart, which aligns with a critical horizontal support zone around $93,000. At the same time, a descending trendline is acting as resistance, keeping the price under pressure.
A breakdown below the marked support zone could trigger a sharp decline toward the next significant level around $88,000. On the other hand, if BTC holds this support and breaks above the descending trendline, it could signal a bullish reversal, pushing the price back toward $98,000 and potentially higher.
A breakdown below the marked support zone could trigger a sharp decline toward the next significant level around $88,000. On the other hand, if BTC holds this support and breaks above the descending trendline, it could signal a bullish reversal, pushing the price back toward $98,000 and potentially higher.
Disclaimer
The information and publications are not meant to be, and do not constitute, financial, investment, trading, or other types of advice or recommendations supplied or endorsed by TradingView. Read more in the Terms of Use.
Disclaimer
The information and publications are not meant to be, and do not constitute, financial, investment, trading, or other types of advice or recommendations supplied or endorsed by TradingView. Read more in the Terms of Use.