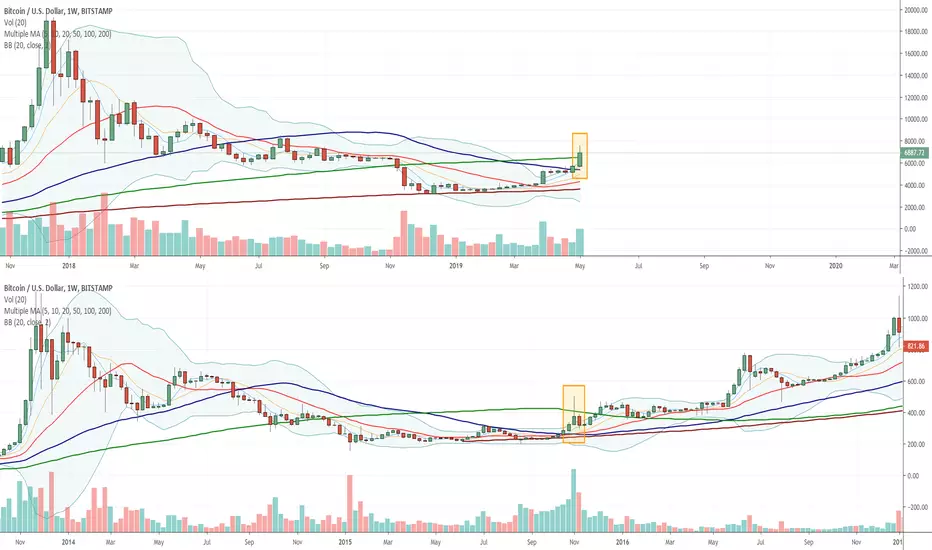
A massive short squeeze was enough for BTC to break up both MA100 ( Blue ) and MA50 ( Green ) and move over 6300$.
This is something we saw back in 2015 and it basically confirmed the end of bear trend.
While it's highly likely we'll see a deeper "technical" pullback on the upcoming days/weeks ( as MA50 still lags under MA100 ), Bitcoin is poised to move much higher on medium term and it's quite likely to consolidate over MA20 ( red ), as it did back in 2015-2016. As you noticed MA20 did turn up already.
MA50/MA100 crossover would finally confirm a strong and firm uptrend.
Note
NOTICEAbove the latest update for my BTC medium term ( 1W ) analysis.
You can read relevant previous posts here:
January 2019:

April 2019:

Note
Technical pullback ongoingNote
Let the pullback unfold, withiut hurrying.As you may nitotice a topping formation ( head & shoulders ) is playing.
Note
A textbook pullback to FIB 0.618 and previous resistance ( now support ) at 6300$.All in one night.
Good to fill some orders.
Accumulate on further weakness, wait for some consolidation.
Note
Note
Broke up the rising wedge, already up 100$.A small gift for daytrading, enjoy.
Note
We recently had a TD Count=18 on Daily.That's a ***very rare*** occurrence.
A TD strip > 9 or 13 means a rather long sequence of days seeing a rising price.
While this has little or no importance at all short term, it has some potentialy interesting implications for the medium term scenario.
Look at the chart below:
Here's two things i want to point out:
1) TD strips exceeding 13 ( red square ) are extremely rare on downtrends / sideway market ( a single red line span ).
2) TD strips exceeding ( all squares, except the red one ) are pretty common into uptrends ( blue line span ).
3) The first TD strip exceeding 13 sequence after a bottom usually marks the start of an uptrend ( see green squares ).
Got the message ?
We''ll see whether we have an "early bird" here or not.
Note
A shame i cannot fix the typos :(Below the fixed message. Sorry.
--
Here's the things i want to point out:
1) TD strips exceeding 13 ( that single red square ) are extremely rare on downtrends / sideway market ( red line span ).
2) TD strips exceeding 13 ( all squares, except the red one ) are pretty common in uptrends ( blue line span ).
3) The first TD strip exceeding 13 after a bottom usually marks the start of an uptrend ( see green squares ).
Note
Short term:Note
!!!
Note
Rising wedge and divergences shown got confirmation.Note
Note
Healthy pullback please ?Note
Posted elsewhere, 1 hour ago.Hanging man + evening star in formation.
We've seen it in action already ;)
Note
To first log support.Note
Approaching uptrend support.Note
Medium term view, by comparison withj 2015-2016:Note
BB bisector should be considered support.Note
Further medium term considerations:
1) MA100 ( green ) is first true support.
2) MA50 ( blue ) still have to cross over MA100, meaning currently uprend is still fragile.
3) MA20 ( red ) is climbing fast. Once 2) is done it may become short term trend support.
Note
Rebound already over 11200$.There's a chance it may nail 11700-12200$ area.
Note
Target area reached, crossroads ahead.Note
Why crossroads ?Because we had a pullback to previous support ( dotted red ), now resistance.
It's the upper bound of a broader rising wedge, with a -seemingly- smaill flag within. 12200-12500$ is resistance.
Short term price can move either way, with a slight bearish bias.
Use some caution and wait for market to pick some direction.
Note
A diamond or not a diamond ?Note
Diamond top are among the *worst pattern to deal with*, as the may actually be half staffs as well.Anyway, we have some noticeable risk of a topping pattern here.
So better acting accordingly and reduce risk.
Note
Alreay 500$ lower, but less resembling a diamond.Mixed scenario.
Note
Inverted H&S, strong resistance ahead.Note
Short term it may rebound, as 9400$ should act as support ( hopefully ).Otherwise it would be rather ugly.
Anyway, mediium term i would expect a further low, unless 11800$ is recovered before monday.
Seems unlikely so far, we'll see.
Note
Breakout of descending channel, pullback to previous support unfolding.Unless price breaks through 11000$ resistance area bears will keep control.
Note
Rejected already.best bet for the bulls would be a further inverted H&S, with a right shoulder ideally above 9800$.
Anyway, unless the bulls manage to pierce through the previous support in 11k area bias keeps bearish.
Disclaimer
The information and publications are not meant to be, and do not constitute, financial, investment, trading, or other types of advice or recommendations supplied or endorsed by TradingView. Read more in the Terms of Use.
Disclaimer
The information and publications are not meant to be, and do not constitute, financial, investment, trading, or other types of advice or recommendations supplied or endorsed by TradingView. Read more in the Terms of Use.