🔍 In-Depth Technical Analysis: BTC/USD (30-Min Chart)
🟩 1. Demand Zone Reaction
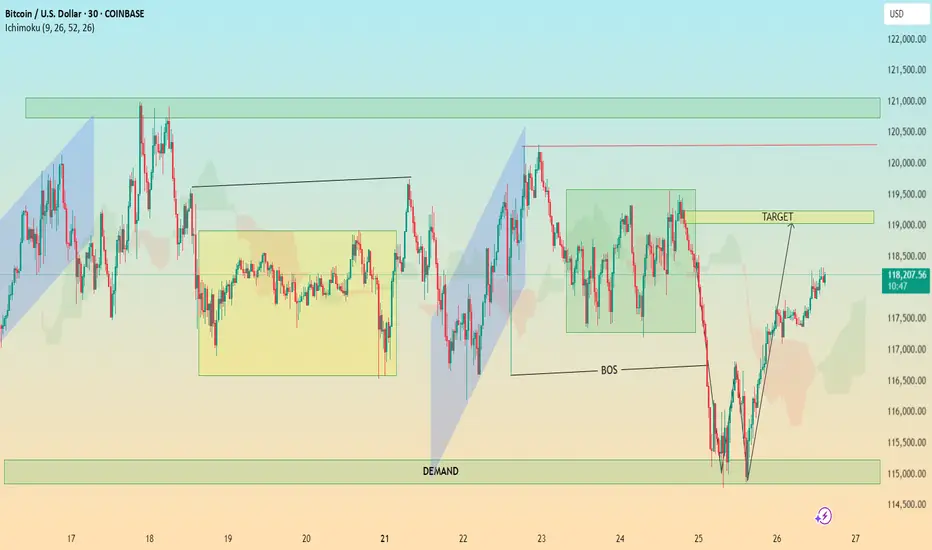
Location: ~$114,500 – $115,500
Significance:
Price sharply reversed after a strong move into this demand zone.
This zone coincides with a liquidity grab below previous lows — textbook Smart Money trap.
Volume (if checked) would likely spike here, indicating institutional interest.
✅ Interpretation: Institutional demand stepped in, absorbing sell orders and triggering a reversal.
📉 2. Break of Structure (BOS)
Zone: Around July 24–25
Price broke below a key higher low, signaling temporary bearish structure.
However, this was quickly reclaimed after demand zone reaction — suggesting a fakeout BOS or a liquidity sweep.
✅ Interpretation: BOS caused shorts to enter, but reversal suggests a bear trap and continuation higher. The BOS served to fuel a more aggressive bullish rally.
🎯 3. Target Zone
Marked Target: ~$118,900–$119,200
Why This Area?
It aligns with a previous consolidation zone / supply before the sharp drop.
Also overlaps with Ichimoku cloud resistance and previous highs — strong confluence.
✅ Interpretation: Price is likely to face resistance here. If broken with strong momentum, bullish continuation to the next supply zone (~$121K) is possible.
⛓️ 4. Market Structure Analysis
Higher Lows Forming after demand reaction.
Price is forming a bullish market structure with an ascending wave pattern.
A break and retest of the $119K zone could lead to a mid-term rally.
Failure to break could result in:
A pullback to the $117,000 area
Or a deeper retest of the demand zone
✅ Trading Plan Options:
Bullish Bias: Buy pullbacks above $117,000 with $119,000 as target
Bearish Bias: Wait for strong rejection at $119,000 to short back to $115K
☁️ 5. Ichimoku Cloud Insight
Price has moved above the cloud, suggesting momentum shift to the upside.
The cloud is twisting bullish, supporting short-term bullish trend.
However, flat Kumo tops around $119K = likely rejection zone.
✅ Interpretation: Ichimoku confirms bullish potential, but price must close above the cloud + $119K zone to sustain trend.
📌 Key Takeaways for Publishing
Chart Idea Title:
“BTC/USD Demand Zone Reversal | Break of Structure & $119K Target in Sight”
Summary Description:
Bitcoin has reclaimed bullish momentum after a sweep into the $115K demand zone. A break of structure triggered shorts, but demand absorption led to a sharp reversal. Now, price is approaching the key $119K supply zone — a critical level that could determine if this is a short-term rally or the beginning of a new trend. Watch for either a clean breakout or a rejection for a possible retest of $117K or lower. Confluence from Ichimoku, BOS, and market structure support the analysis.
🟩 1. Demand Zone Reaction
Location: ~$114,500 – $115,500
Significance:
Price sharply reversed after a strong move into this demand zone.
This zone coincides with a liquidity grab below previous lows — textbook Smart Money trap.
Volume (if checked) would likely spike here, indicating institutional interest.
✅ Interpretation: Institutional demand stepped in, absorbing sell orders and triggering a reversal.
📉 2. Break of Structure (BOS)
Zone: Around July 24–25
Price broke below a key higher low, signaling temporary bearish structure.
However, this was quickly reclaimed after demand zone reaction — suggesting a fakeout BOS or a liquidity sweep.
✅ Interpretation: BOS caused shorts to enter, but reversal suggests a bear trap and continuation higher. The BOS served to fuel a more aggressive bullish rally.
🎯 3. Target Zone
Marked Target: ~$118,900–$119,200
Why This Area?
It aligns with a previous consolidation zone / supply before the sharp drop.
Also overlaps with Ichimoku cloud resistance and previous highs — strong confluence.
✅ Interpretation: Price is likely to face resistance here. If broken with strong momentum, bullish continuation to the next supply zone (~$121K) is possible.
⛓️ 4. Market Structure Analysis
Higher Lows Forming after demand reaction.
Price is forming a bullish market structure with an ascending wave pattern.
A break and retest of the $119K zone could lead to a mid-term rally.
Failure to break could result in:
A pullback to the $117,000 area
Or a deeper retest of the demand zone
✅ Trading Plan Options:
Bullish Bias: Buy pullbacks above $117,000 with $119,000 as target
Bearish Bias: Wait for strong rejection at $119,000 to short back to $115K
☁️ 5. Ichimoku Cloud Insight
Price has moved above the cloud, suggesting momentum shift to the upside.
The cloud is twisting bullish, supporting short-term bullish trend.
However, flat Kumo tops around $119K = likely rejection zone.
✅ Interpretation: Ichimoku confirms bullish potential, but price must close above the cloud + $119K zone to sustain trend.
📌 Key Takeaways for Publishing
Chart Idea Title:
“BTC/USD Demand Zone Reversal | Break of Structure & $119K Target in Sight”
Summary Description:
Bitcoin has reclaimed bullish momentum after a sweep into the $115K demand zone. A break of structure triggered shorts, but demand absorption led to a sharp reversal. Now, price is approaching the key $119K supply zone — a critical level that could determine if this is a short-term rally or the beginning of a new trend. Watch for either a clean breakout or a rejection for a possible retest of $117K or lower. Confluence from Ichimoku, BOS, and market structure support the analysis.
Trade active
♦JOIN FREE TELEGRAM CHANNEL✅
🔗 t.me/+4JhbHmt-Lf41NzZk
✅FOREX AND GOLD/XAUUSD SIGNALS
✅98% ACCURATE SIGNALS
✅4-6 signals daily 💯💯
♦♦Join telegram Group♦♦
🔗 t.me/+4JhbHmt-Lf41NzZk
🔗 t.me/+4JhbHmt-Lf41NzZk
✅FOREX AND GOLD/XAUUSD SIGNALS
✅98% ACCURATE SIGNALS
✅4-6 signals daily 💯💯
♦♦Join telegram Group♦♦
🔗 t.me/+4JhbHmt-Lf41NzZk
Disclaimer
The information and publications are not meant to be, and do not constitute, financial, investment, trading, or other types of advice or recommendations supplied or endorsed by TradingView. Read more in the Terms of Use.