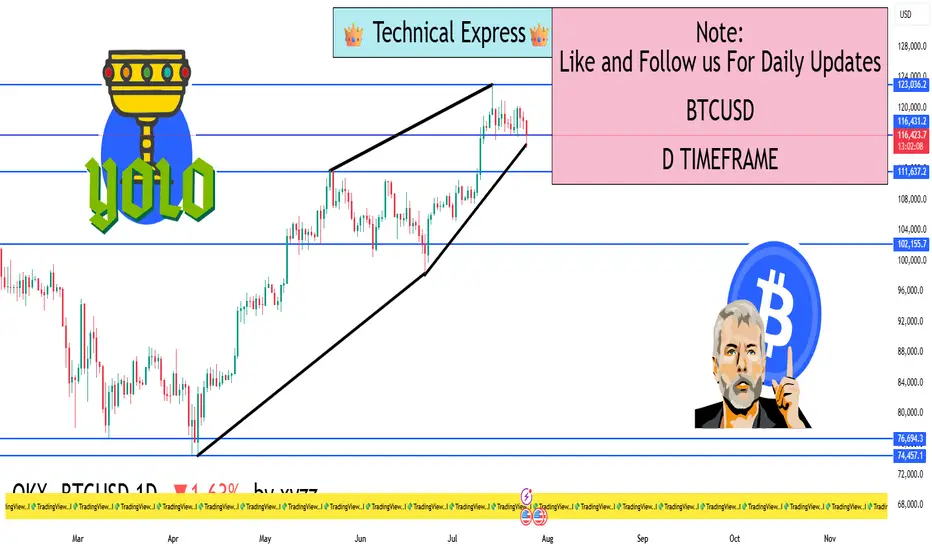
📈 BTC/USD 1D Timeframe Overview (as of Today)
Current Price: Around $116,100
Price Change: Down by approximately 2.1% from the previous close
Day’s High: Around $119,436
Day’s Low: Around $115,002
📊 Chart Analysis (1-Day Candle)
Each candle on the 1D chart represents one full day. Today’s candle shows:
Bearish Momentum: The candle is red, indicating sellers dominated.
Wick at Bottom: Suggests some buying pressure or support near the day's low.
Rejection from Highs: Price tried to go higher but failed, showing resistance near $119,400.
🔍 Key Support and Resistance Levels
Resistance Zone: $119,000 – $120,000 (recent highs)
Support Zone: $115,000 – $113,500 (demand area and previous consolidation)
If BTC breaks below the $115,000 support, it may test lower levels like $112,000 or $110,000. If it bounces, it could reattempt $120,000.
🧠 Technical Perspective (Daily View)
Trend: BTC is currently in a short-term pullback phase after a recent rally.
Structure: Higher lows are intact if it stays above $112,000, which suggests uptrend continuation.
Volume: Decreasing volume on red candles could mean weak selling — possible sign of reversal soon.
🔄 Daily Timeframe Strategy Insight
Swing Traders: Wait for bullish reversal candle or break above resistance to go long.
Breakout Traders: Watch if price breaks and closes above $120,000 for trend continuation.
Risk-averse Traders: Wait for confirmation of direction before entering (like bullish engulfing or hammer candle).
📉 Summary
BTC is showing short-term weakness but remains in a larger range.
$115,000 is the key short-term support, and $120,000 is the key resistance.
Watch for candle patterns, volume, and reaction at support/resistance zones.
Hello Guys ..
WhatsApp link- wa.link/d997q0
Email - techncialexpress@gmail.com ...
Script Coder/Trader//Investor from India. Drop a comment or DM if you have any questions! Let’s grow together!
WhatsApp link- wa.link/d997q0
Email - techncialexpress@gmail.com ...
Script Coder/Trader//Investor from India. Drop a comment or DM if you have any questions! Let’s grow together!
Related publications
Disclaimer
The information and publications are not meant to be, and do not constitute, financial, investment, trading, or other types of advice or recommendations supplied or endorsed by TradingView. Read more in the Terms of Use.