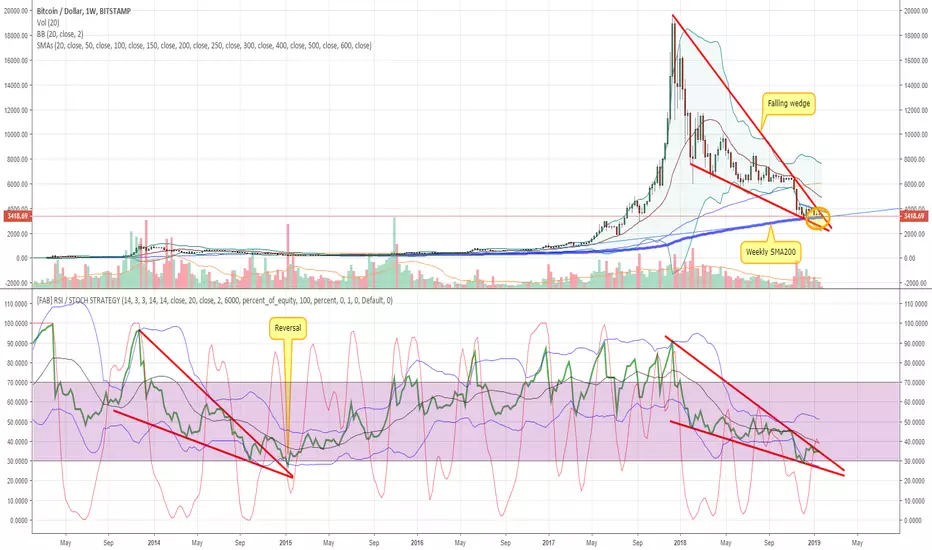
Bears may push price down to 3250-3300$ ( key support area ) or even into low 2000$.
Yet as long as that falling wedge holds bulls will finally have the upper hand.
So it's a Long already ?
Not yet, but maybe it's not that far.
It's *about time* to stop caring about the bottom and to start *patiently building* a Long medium term position.
Use dips to your own advantage.
Yet as long as that falling wedge holds bulls will finally have the upper hand.
So it's a Long already ?
Not yet, but maybe it's not that far.
It's *about time* to stop caring about the bottom and to start *patiently building* a Long medium term position.
Use dips to your own advantage.
Note
Mind the fact that both MONTHLY RSI and Stoch RSI sit on long term static supports.*IF* bulls manage to have January closing over these supports then a reversal may happen. We'll know within a very few days.
Note
Godmode is flashing reversal warnings by weeks now.Be patient, get ready to jump in.
Let's see january monthly close on RSI.
Note
So january close broke RSI support.Sixth red month in a row, lomgest red monthly candles strip ever.
This means 2 things imho: more chance of capitulation, but (anyway) sooner reversal.
Below the anatomy of 2018/19 correction vs 2014/15.
It's based on God Mode and LSMA.
It actually explains why i don't actually care about bottom anymore.
Note
Now lat's look at Lunar new Year, coming Feb 5th.Note
Finally, Weekly RSI.Note
"April 2020" in the balloon above is a typo. It's April 2019 actually ...Sorry.
Note
Almost there.MA break-up will likely hint the ending phase of correction.
Build your position wisely, use dips at your advantage.
Always keep a good degree of liquidity at hand, as a final capitulation can still happen and it should be a buying opportunity.
Don't get caught off guard.
Note
In the meantime SMA200/1W testing ongoing.Let's see whether bulls can push up from here.
Otherwise price may route towards the lower bound of our falling wedge.
Overall picture is unchanged since opening post.
Note
Bulls did bush up.Now they should manage to break through 3800$ to 4100$.
A higher high is needed, then anything may happen.
Note
Still under 3800$.Currently within a (much stretched) bullish flag, which may end into a "bart".
To avoid that price shoud try to break up soon, or it will be rejected towards support.
Moreover price action is basically range based, further confined within a broader descending channel.
What's still lacking is volume, that's the biggest problem.
Note
Zoom:Note
Hopefully ...Note
Looks fine so far, let's see whether 3700-3800$ can be the base for some consolidation.As i wrote almost 2 weeks ago, 3800-4100$ is area of resistance.
Note
Patience.Note
Update:NVT crossover past week, about to be confirmed.
So far so good on Godmode.
Monthly RSI back over long time support.
Disclaimer
The information and publications are not meant to be, and do not constitute, financial, investment, trading, or other types of advice or recommendations supplied or endorsed by TradingView. Read more in the Terms of Use.
Disclaimer
The information and publications are not meant to be, and do not constitute, financial, investment, trading, or other types of advice or recommendations supplied or endorsed by TradingView. Read more in the Terms of Use.