May be market bullish in up side.
🛠 Trade Setup :
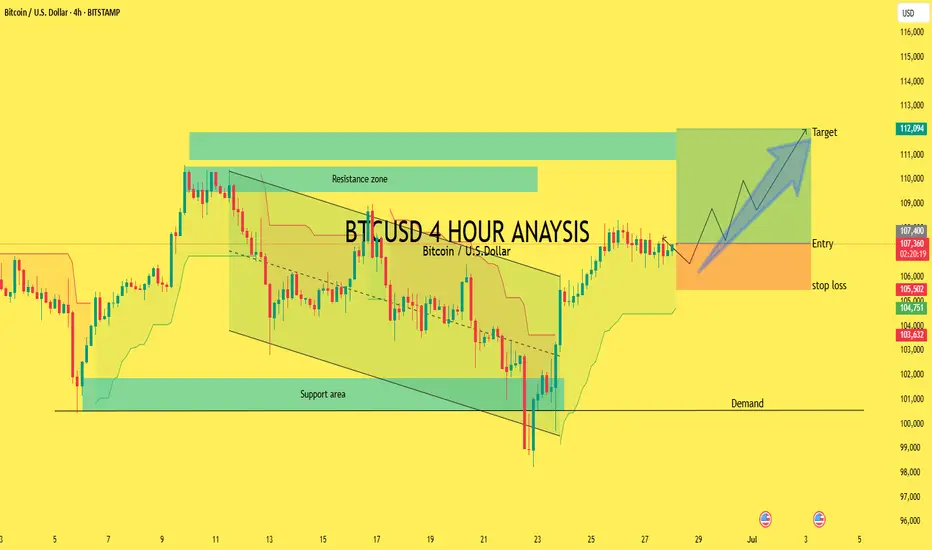
Entry Around $107,000
Stop Loss ~$105,000–$104,000
Target ~$112,000
📊 Key Technical Elements
1. Falling Wedge Pattern (Bullish)
A clear falling wedge is visible between June 11 to June 23. Breakout occurred to the upside, which is a bullish signal. Price broke out with strong momentum, confirming buyers stepping in.
2. Support & Demand Zones
Support Area: ~$103,000–$104,000 — price bounced strongly from here. Demand Zone: Below $103,000 — marked as a last-resort buying interest zone.
3. Resistance Zone (Target Zone)
Resistance Area: ~$111,000–$112,000 — this is the target region. This area has previously acted as resistance and may again.
🛠 Trade Setup :
Entry Around $107,000
Stop Loss ~$105,000–$104,000
Target ~$112,000
📊 Key Technical Elements
1. Falling Wedge Pattern (Bullish)
A clear falling wedge is visible between June 11 to June 23. Breakout occurred to the upside, which is a bullish signal. Price broke out with strong momentum, confirming buyers stepping in.
2. Support & Demand Zones
Support Area: ~$103,000–$104,000 — price bounced strongly from here. Demand Zone: Below $103,000 — marked as a last-resort buying interest zone.
3. Resistance Zone (Target Zone)
Resistance Area: ~$111,000–$112,000 — this is the target region. This area has previously acted as resistance and may again.
Trade closed: stop reached
our tp 1 is hit then sl hit sorry for sl .Best Analysis xauusd single
t.me/+uAIef7IqwSs4M2Q0
VIP PREMIMUM ANALYSIS ROOM SIGNALS
t.me/+uAIef7IqwSs4M2Q0
t.me/+uAIef7IqwSs4M2Q0
VIP PREMIMUM ANALYSIS ROOM SIGNALS
t.me/+uAIef7IqwSs4M2Q0
Disclaimer
The information and publications are not meant to be, and do not constitute, financial, investment, trading, or other types of advice or recommendations supplied or endorsed by TradingView. Read more in the Terms of Use.
Best Analysis xauusd single
t.me/+uAIef7IqwSs4M2Q0
VIP PREMIMUM ANALYSIS ROOM SIGNALS
t.me/+uAIef7IqwSs4M2Q0
t.me/+uAIef7IqwSs4M2Q0
VIP PREMIMUM ANALYSIS ROOM SIGNALS
t.me/+uAIef7IqwSs4M2Q0
Disclaimer
The information and publications are not meant to be, and do not constitute, financial, investment, trading, or other types of advice or recommendations supplied or endorsed by TradingView. Read more in the Terms of Use.