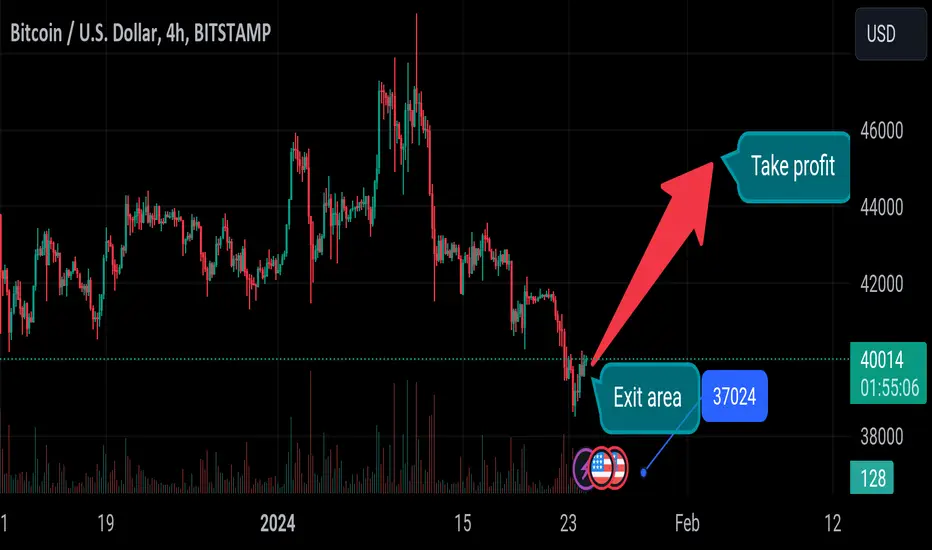
The 4H chart shows that the BTC/USD pair has been in a strong bullish trend in the past few days. It remains below the 50-period and 25–period Exponential Moving Averages (EMA). The pair has also dropped below the Ichimoku cloud and the lower side of the Donchian channels. Also, the Relative Strength Index (RSI) has moved below the oversold point.
Therefore, the pair will likely have a dead cat bounce and retest the resistance at 45.000 and then resume the uptrend trend.
Therefore, the pair will likely have a dead cat bounce and retest the resistance at 45.000 and then resume the uptrend trend.
Disclaimer
The information and publications are not meant to be, and do not constitute, financial, investment, trading, or other types of advice or recommendations supplied or endorsed by TradingView. Read more in the Terms of Use.
Disclaimer
The information and publications are not meant to be, and do not constitute, financial, investment, trading, or other types of advice or recommendations supplied or endorsed by TradingView. Read more in the Terms of Use.