I am engaged in extrasensory stock charts, that is, feeling the energy of the future chart, this is a meditative technique, and the sensations are mainly tactile.
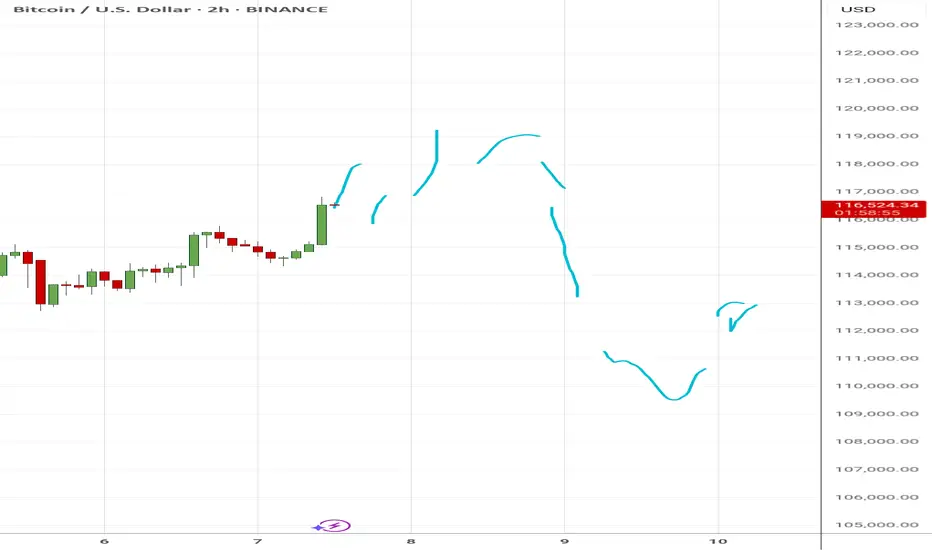
The forecast for August 7, 8, and 9 is generally depicted on the chart, UTC time. There will be upward impulses on August 7 and in the first half of August 8, however, by the end of August 8, a downward movement will begin almost until the second half of August 9. The downward movement will be strong.
At the moment, I am not analyzing the prices, only paying attention to the price movement impulses. I consider my forecast to be good if the outline of the real chart matches the outline of the chart I drew as a forecast, meaning that the direction and time period of the price movement are correctly indicated.
Disclaimer
The information and publications are not meant to be, and do not constitute, financial, investment, trading, or other types of advice or recommendations supplied or endorsed by TradingView. Read more in the Terms of Use.
Disclaimer
The information and publications are not meant to be, and do not constitute, financial, investment, trading, or other types of advice or recommendations supplied or endorsed by TradingView. Read more in the Terms of Use.