Before we go anywhere with this, we MUST remember that a "TREND LINE " requires a minimum of 3 points of Contact to make it Valid. The more points of contact the better.
All of these Trend lines in this chart are therefore Valid.
But what needs to be questioned is maybe the PA trend between the lines......
And because of the Scale of this, we are using only 2 past Factual data sets and one expected.
So NOT a confirmed Trend
But I shall continue anyway as there are a number of things that make this idea a possibility.
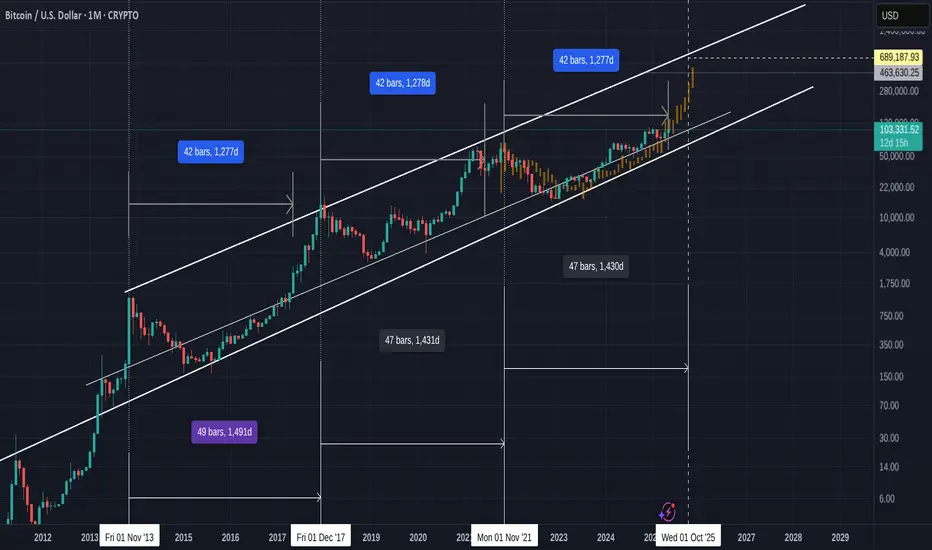
So, on the chart we have the Upper and Lower day counts.
The Lower is number of days between ATH
2013 -> 2017 = 1491 days
2017 -> 2021 = 1431 days
2021 -> 2025 = ...............Expected anytime from October to Dec. This is IF we follow the "pattern"
50 day difference between the 2 sets of Past data
The Upper day count uses just ONE data point from the 2013 -> 2017 cycle. It is from the ATH to when PA made the BIG move to begin the climb to ATH. That was around 1277 days after the 2013 ATH and you can see the candle that rose off that line of support was substantial.
As many of you know, I am firmly in the belief that this run is mimicking the 2013 -> 2017 run in many ways
So, The same day count takes us past the First 2021 ATH, which I have always said was a "False" ATH in that PA was driven High, to early, by leveraged and hopeful gains.
However, if you look at the distance from the end of that day count to when the ATH was reached, it is similar to the 2017 ATH
So if we Project that same day count onto current PA, THIS MONTH is the month for take off.
And again, See the difference between the end of the day count and the projected ATH daye.
Similar to previous occasions.
This is also reflected on the Fractal, that arrives on the upper trend line in November.
One thing that makes me hesitate a little here is the projected ATH Price of Near 700K USD.
I am not sure that is going to happen....And so we wait to see what happens.
But I will watch this and see where we go
I have pointed out in another chart, how Bitcoin PA is under a Very long time Arc of resistance and this could be in play and if so, This chart Will become invalidated.
We Wait to see
Nothing to be taken as Financial advice.
I will always say
"Only invest what you can afford to loose. When you are ready, take out your original investment. This way, it is only your profit that is at risk"
THAT is Financial advice
I will always say
"Only invest what you can afford to loose. When you are ready, take out your original investment. This way, it is only your profit that is at risk"
THAT is Financial advice
Disclaimer
The information and publications are not meant to be, and do not constitute, financial, investment, trading, or other types of advice or recommendations supplied or endorsed by TradingView. Read more in the Terms of Use.