Calm Down, everything is currently fine if your concerned. I will provide you a synopsis of is happening right now and why there is nothing really to be concerned of as of yet.
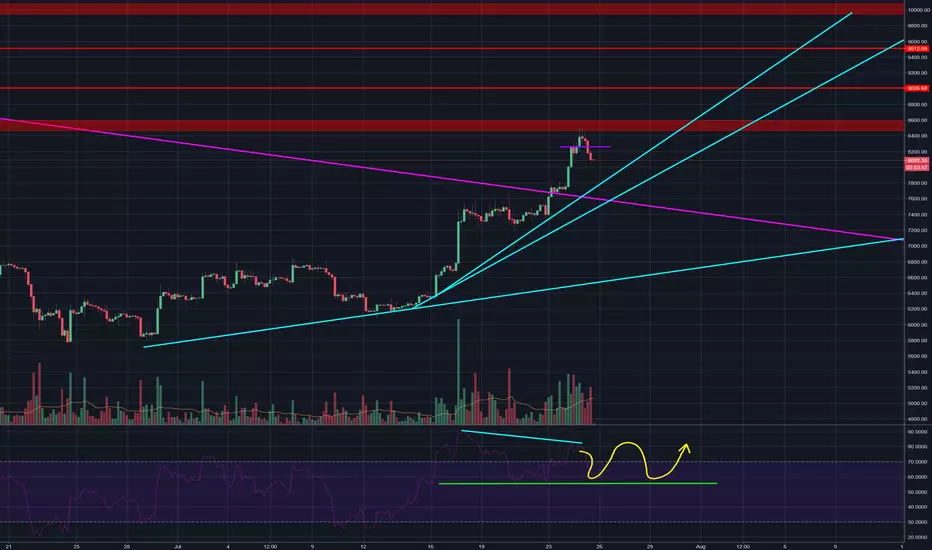
Bitcoin did make a move downwards, which was something I expected and I had mentioned it prior, in the light blue, I have drawn three tentative trendlines, and currently, they have yet to be tested because it requires three touches to form an actual trendline currently these are just possible trendlines. On the bottom of the chart, you can see the 4 hour RSI and there is a warning of a possible divergence, however, I do not believe it will become an actual bearish divergence because it must break the support created by the two troughs which can be seen in green, as a matter of fact, it can be said that bitcoin has space to move to 7900, and after that, I would expect sideways movement to either the first, second, or before touching the trendlines to expect another movement up. In yellow, I am expecting to see a path very similar to that, and I am expecting another large movement upwards. However, it is possible that the support on the RSI breaks and in the 45 minute time frame, there was a short term reversal of a double top which did occur on a bearish divergence within that time frame. Currently, there is still space on the larger time frames to make moves to the upside, however, I expect that this is the end of this short term stretch upwards and we are going to be taking a pause on the longer time frames which is a healthy consolidation. If the support of the 4hr RSI breaks, it would confirm the bearish divergence and it will probably mean a further move down to test the trendlines or a longer amount of time consolidating or both.
Key Points:
1.) There is a short term reversal, on the 45 minute time frame after really strong movements upwards the last two days and a move down to the 7900 levels would still be acceptable, even 780.
2.) The 4 hour RSI still has support which could possible reject the bearish divergence in that time frame, in addition, there are still trendlines to be tested.
3.) Another bull flag could possible form and if it does the price objective would be in the 9k levels.
Best of Luck Trading: Trade Smart, Hedge Risk, and Make Money!
Also, if you like my analysis check out my other Stuff!
Previous Analysis:
Note
This is a really important update to this idea. Okay so there are multiple things that I want you to look at when you look at this image:First we are going to talk about the possible Bearish Divergence, right now the bulls are trying to push the price back up and the RSI is accounting for that however, the drop was very quick so it showed a lot of strength, however it is not over and the bulls can still push the RSI back into the support zone.
Second, the volume of this drop occured on more volume than that of the bull which might be enough to invalidate the flag and a new pattern may emerge. However only time can tell.
Third, it did bounce of the green trendline that I have drawn and the orange support of the bull flag is still holding.
In the end, I believe that most people thought of 8000 as a strong support, however that was not the case and once that price point had been hit stop losses were triggered, but that is only speculation. IF the bearish divergence is complete, there will be another subsequent drop to the next trendline or sideways movement.
tradingview.com/chart/6speRo1N/
Note
Note
Note
The selling is remaining strong and it is still pushing the price further down, I suspect that either the purple trendline or the 200 day EMA to be support, but I do not know what will happen. The breaking of the supports were enough to liquidate most positions anyway...
Note
Okay, so Bitcoin looks better on the daily than the 4 hour, there is still support in the RSI and Bitcoin's Price is just barely in the bull flag range, in addition, the volume still supports the idea of a bull flag, at this point it really depends on what the bulls are capable of if they indent on pushing the price upwards. There are still multiple trendlines that bitcoin can test when falling down, however, a fall under the purple trendline would mean that it would be returning to a downtrend that it just escaped. Note
That drop cam really unexpectedly and the news did as well, I am surprised it did not drop further, the bulls won't give this one up without a fight, and I suspect a lot of sideway movement to occur. The prior resistance of the longer term symmetrical triangle (Purple) should provide strong support.Note
Bitcoin was pushed back into its bull flag, and the selling for the most part has receded, that small burst downwards could have been the population dumping on news events. As the saying goes, "Buy on rumors, sell on news," so news coverage whether it be good or bad has a dump but depending on the news it will effect the dump to a greater or lesser extentNote
Wrong imageNote
The daily RSI has found support.tradingview.com/chart/6speRo1N/
Note
Disclaimer
The information and publications are not meant to be, and do not constitute, financial, investment, trading, or other types of advice or recommendations supplied or endorsed by TradingView. Read more in the Terms of Use.
Disclaimer
The information and publications are not meant to be, and do not constitute, financial, investment, trading, or other types of advice or recommendations supplied or endorsed by TradingView. Read more in the Terms of Use.