__________________________________________________________________________________
Technical Overview – Summary Points
__________________________________________________________________________________
__________________________________________________________________________________
Strategic Summary
__________________________________________________________________________________
__________________________________________________________________________________
Multi-Timeframe Analysis
__________________________________________________________________________________
__________________________________________________________________________________
Cross Analysis & Executive Summary
__________________________________________________________________________________
__________________________________________________________________________________
Macro & On-chain Focus
__________________________________________________________________________________
__________________________________________________________________________________
Operational Action Plan
__________________________________________________________________________________
__________________________________________________________________________________
Technical Overview – Summary Points
__________________________________________________________________________________
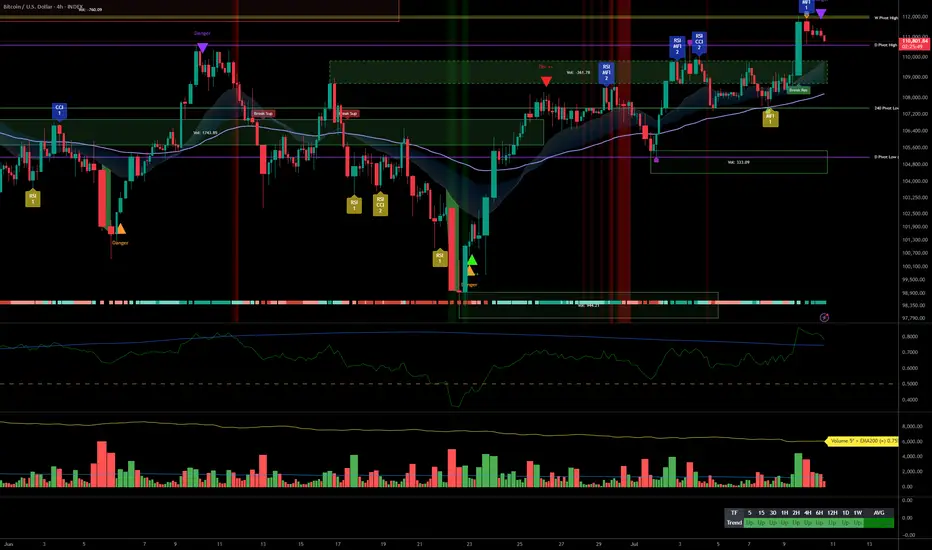
- Momentum: Very strong bullish bias across all major timeframes. No selling signal detected; slight micro-pause on 15min.
- Key Supports / Resistances: Immediate resistance at 111,000–112,500. Critical supports: 108,000–109,000, then 105,000. Any lasting break below 107,500 is a key alert.
- Volume: Healthy, balanced volumes. Some moderate surges on 1H/2H, but no climax.
- Risk On / Risk Off Indicator: Strong Buy across all TFs except 15min (partial pause).
- Multi-TF behavior: Complete convergence. No sign of distribution. ISPD DIV neutral overall.
__________________________________________________________________________________
Strategic Summary
__________________________________________________________________________________
- Dominant bias: Bullish, confirmed by both technical and on-chain context.
- Opportunities: Add on retracements to major supports (108k–109k, potentially 105k). Target breakout >112.5k for extension or further swing adds.
- Risk/Alert Zones: Breakdown <107.5k (especially with high volume/macro event). Congestion zone at 111–112.5k: monitor reactions and volumes closely.
- Macro catalysts: FOMC, Jobless Claims, Bond Auction (see economic calendar). Adjust sizing before and after.
- Action plan: Gradual buys on major supports; heightened monitoring pre-US announcements (avoid overexposure during high-volatility). Structural stop below 107.5k; for swing, <105k ideal.
__________________________________________________________________________________
Multi-Timeframe Analysis
__________________________________________________________________________________
- 1D: Structurally solid market above key supports. No divergence or selling signals. Resistances: 111,500–112,500. Main support: 105,050.
- 12H: Dominant buyer pressure. Key support at 107,500–108,000. No speculative excess.
- 6H: Marked accumulation. Multi-TF resistance at 111,000–111,500.
- 4H: All trends aligned; focus on resistance 111–112k.
- 2H: Ongoing momentum. Moderate volume. Watch 107,400–108,000 for dips.
- 1H: Reinforced bullish bias; no short-term weakness.
- 30min: Opportunities on any pullback to supports (110,400, 109,000).
- 15min: Micro-pause on sector momentum. Potential consolidation below 111k–111,500.
- Risk On / Risk Off Indicator: Strong Buy on all TFs except 15min (neutral, no sell).
- ISPD DIV: Neutral across the curve, no behavioral excess detected.
__________________________________________________________________________________
Cross Analysis & Executive Summary
__________________________________________________________________________________
- Confluences: Major bullish bias. Risk On / Risk Off Indicator in Strong Buy (except 15min). Balanced volumes. ISPD DIV neutral.
- Dissonances: Micro-pause on 15min momentum under resistance (possible very short-term consolidation).
- Opportunities: Pullbacks to 108k–109k or even 105k, clear breakout above 112.5k.
- Risks: Break below 107,500 (key alert), high volume+rejection under 111–112.5k (possible profit-taking).
__________________________________________________________________________________
Macro & On-chain Focus
__________________________________________________________________________________
- Macro: Awaiting FOMC (late July), key US macro data (Jobless Claims, 30Y Bond Auction). Neutral to potentially high volatility environment around economic catalysts.
- On-chain: Long-term holder supply at ATH. US ETF inflows positive. Healthy on-chain: little short-term top risk. Key on-chain threshold at 98.3k (Short-Term Holder Cost Basis).
- Institutional: No panic, ongoing “disciplined accumulation”, no excess euphoria.
__________________________________________________________________________________
Operational Action Plan
__________________________________________________________________________________
- Closely monitor 111–112.5k resistance: reactively adapt based on price/volume.
- Gradual re-entries on major supports if no behavioral anomaly or excessive selling volume.
- Structural stop <107.5k, swing invalidation <105k.
- Swing opportunity window post-FOMC if dovish or calm.
- Adjust exposure and risk management around key macro dates.
__________________________________________________________________________________
Disclaimer
The information and publications are not meant to be, and do not constitute, financial, investment, trading, or other types of advice or recommendations supplied or endorsed by TradingView. Read more in the Terms of Use.
Disclaimer
The information and publications are not meant to be, and do not constitute, financial, investment, trading, or other types of advice or recommendations supplied or endorsed by TradingView. Read more in the Terms of Use.