__________________________________________________________________________________
Technical Overview
__________________________________________________________________________________
__________________________________________________________________________________
Strategic Summary
__________________________________________________________________________________
__________________________________________________________________________________
Multi-Timeframe Analysis
__________________________________________________________________________________
__________________________________________________________________________________
Visual summary:
__________________________________________________________________________________
__________________________________________________________________________________
Technical Overview
__________________________________________________________________________________
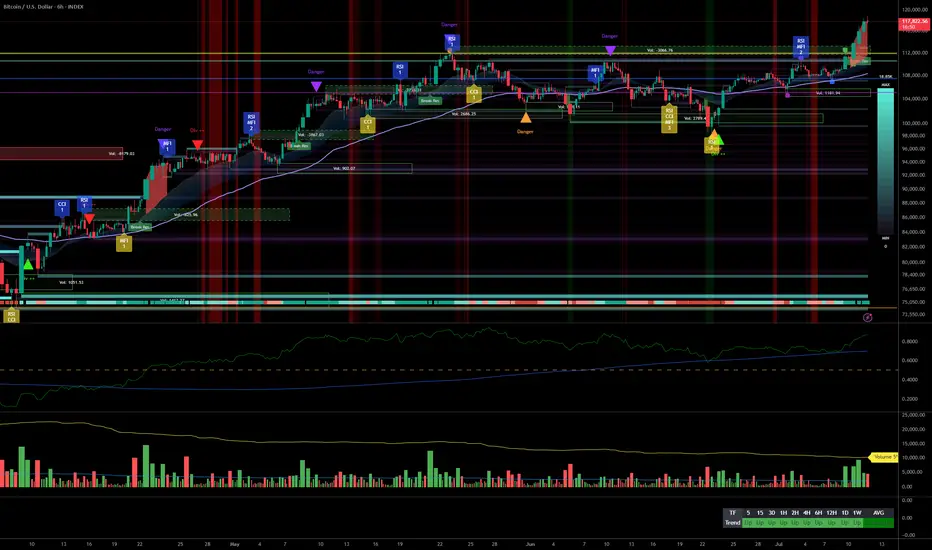
- Strong bullish momentum validated across all timeframes (MTFTI “Strong Up”).
- Key supports to watch: 116.2K$, 114K$, 111K$; any break could hasten a correction.
- Extreme volumes on 4H/2H/1H with “Sell” behavioral alerts (ISPD DIV), short-term overbought conditions.
- Risk On / Risk Off Indicator signals mostly Buy or Neutral by timeframe, tech leadership intact, no macro weakness.
- Likely consolidation or pullback below 117.7K$; renewed opportunities at supports.
__________________________________________________________________________________
Strategic Summary
__________________________________________________________________________________
- Bias: Structurally ultra-bullish, but caution on short-term excess signals.
- Opportunities: Accumulation on dips (116.2K$–114K$), potential breakout if volume remains healthy.
- Risks: Overheated short-term (high volumes + behavioral alerts), technical pullback to watch.
- Catalyst: Awaiting macro trigger: next FOMC late July or market flow shock.
- Action plan: Buy on support retest; actively manage stops below 114/111K$; partial profit-taking in overbought conditions.
__________________________________________________________________________________
Multi-Timeframe Analysis
__________________________________________________________________________________
- 1D: Very bullish structure, above major resistances. No sell signals, short-term overbought (>117K$) to monitor; exploit retracements for accumulation; Risk On / Risk Off Indicator = Buy.
- 12H: Clean momentum, supported by indicators. Consolidation or breakout possible under 119K$.
- 6H: Strong bullish trend, elevated but healthy volume. Caution on rotation; Risk On / Risk Off Indicator = Buy.
- 4H: Strong impulse, behavioral “Sell” signals (ISPD DIV). Watch for short-term reversal.
- 2H: Mature uptrend, buyer climax, high probability of imminent technical pullback.
- 1H: Local top risk, caution advised (tight stops), secure profits on support break.
- 30min: Losing momentum, consolidation likely. First Risk On / Risk Off Indicator slow-down.
- 15min: Neutral, weaker momentum. Immediate entries are risky, wait for pullback.
Strong directional alignment on all timeframes, but repeated short-term overheating signals: calls for tactical action and proactive risk/reward management. No macro or fundamental bearish catalysts.
__________________________________________________________________________________
Visual summary:
__________________________________________________________________________________
- Main bias: BULLISH
- Opportunities: Buying on supports / breakout if volume healthy
- Risks: Short-term overheating, technical pullback
- Invalidation: Close below 114/111K$
- Key catalyst: Post-FOMC volatility late July, or flow shock
- Fundamental/on-chain summary: Dominant accumulation, compressed volatility, no macro headwind.
__________________________________________________________________________________
Disclaimer
The information and publications are not meant to be, and do not constitute, financial, investment, trading, or other types of advice or recommendations supplied or endorsed by TradingView. Read more in the Terms of Use.
Disclaimer
The information and publications are not meant to be, and do not constitute, financial, investment, trading, or other types of advice or recommendations supplied or endorsed by TradingView. Read more in the Terms of Use.