This is a long term analysis based on Monthly timeframe. Mind that.
While shorter term picture is mixed and shows a lot of uncertainty, we can spot some encouraging long term hints.
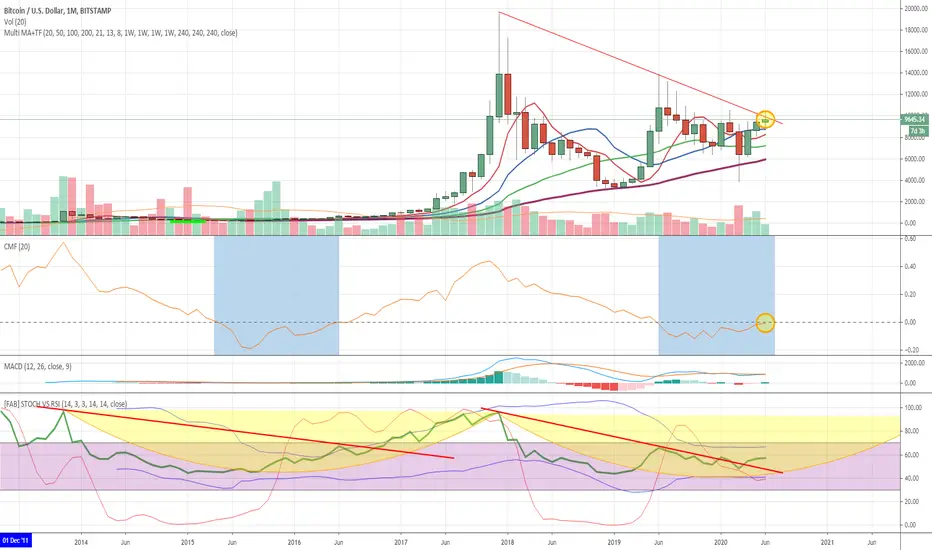
From top to bottom:
Candlestick chart shows price challenging long term resistance trendline, which should be considered trend reversal limit. That's a critical point for both bulls and bears. We can appreciate price being again over all short-to-medium term weekly MAs (20/50/100/200), still in wait of a (bullish) crossover of MA20/W (red) over MA50/W (blue). We may also appreciate some rather high volume on march higher low, which may suggest a double bottom setup.
CMF ( Chaiking Money Flow ) is approaching again zero level, possibly about to close a 1 year sub-zero pocket similar to the one back in 2015-2016.
The latter was preceeding one of the longest and strongest bull runs in Bitcoin history.
RSI / Stoch RSI shows breakout of long term resistance and -seemingly- a repeated cup formation whose edge may fall around Q1 2021.
We should assume that once RSI will climb over 67 price shall move quickly.
Finally we should consider that -shorter term- Hash Ribbons "qualitative" indicator seems about to confirm its first "blue dot" buy signal:

That's a bullish long term setup.
While shorter term a further (even strong) shakeout cannot be ruled out, it may well be an interesting accumulation opportunity for a longer term ( 1 to 1,5 yrs ) investment.
You may want to consider that once price starts gaining some traction -and it may happen at ANY time by now- things will move pretty quickly.
So you'd better have a long term position building strategy by now.
That's my opinion, as usual, DYOD.
While shorter term picture is mixed and shows a lot of uncertainty, we can spot some encouraging long term hints.
From top to bottom:
Candlestick chart shows price challenging long term resistance trendline, which should be considered trend reversal limit. That's a critical point for both bulls and bears. We can appreciate price being again over all short-to-medium term weekly MAs (20/50/100/200), still in wait of a (bullish) crossover of MA20/W (red) over MA50/W (blue). We may also appreciate some rather high volume on march higher low, which may suggest a double bottom setup.
CMF ( Chaiking Money Flow ) is approaching again zero level, possibly about to close a 1 year sub-zero pocket similar to the one back in 2015-2016.
The latter was preceeding one of the longest and strongest bull runs in Bitcoin history.
RSI / Stoch RSI shows breakout of long term resistance and -seemingly- a repeated cup formation whose edge may fall around Q1 2021.
We should assume that once RSI will climb over 67 price shall move quickly.
Finally we should consider that -shorter term- Hash Ribbons "qualitative" indicator seems about to confirm its first "blue dot" buy signal:
That's a bullish long term setup.
While shorter term a further (even strong) shakeout cannot be ruled out, it may well be an interesting accumulation opportunity for a longer term ( 1 to 1,5 yrs ) investment.
You may want to consider that once price starts gaining some traction -and it may happen at ANY time by now- things will move pretty quickly.
So you'd better have a long term position building strategy by now.
That's my opinion, as usual, DYOD.
Note
Awaiting sufficient momentum.Note
Some shorter term speculation.Bulls still need to breakout 9350$, though.
hence a mere hyphotesis.
Note
OBV indicator currently near its ATH.Note
See also:![[Long Term] OBV at its own ATH hints ongoing accumulation.](https://s3.tradingview.com/b/Bropn5tH_mid.png)
Note
Look at monthly CMF now:If bulls manage to achieve an over zero close at the end of July (hence a confirmation) ... you guess it ...
Note
Blue dot confirmation pending on daily:Watch today close.
Note
Blue dot confirmed on daily close.Note
Weekly chart.Still on the edge.
Watch support.
Note
Nearing first KEY resistance, beware.Note
Let's see in another way:Bulls hould confirm that flag / support should hold.
Then moon, eventually.
Note
Intraday high at 10455$.So price is now at main static resistance.
Looking forward to weekly and monthly close, aftr CME Futures expiration on Friday 31th.
Note
We can appreciate the breakout of the flag:Morevover price broke up long term resistance ( still to be confirmed on weekly close! ) and set an higher high.
Price naturally moved straight up to closest resistance, being in our case upper limit of weekly BB:
A pullback from there would be physiological, whereas a -less likely- confirmed breakout of upper BB on weekly close would be an extremely bullish event.
Anyway, as i wrote days ago, we have to evaluate situation after CME futures expiration, on Friday 31th.
That's next important hurdle. Let's avoid surprises.
After that we'll have to check weekly and monthly close: i mentioned before CMF and OBV, let's see them on weekly/monthly close.
So far so good, but still we're not out of the woods (yet).
Confirmation neeeded.
Note
Notice MA20/W is about to cross-up MA50/W.Bullish if confirmed on weekly close.
Note
MA20/W is red, MA50/W is blue.Note
OBV seemingly hinting it's a matter of time before the run, which should be ignited by breakut of previous ATH:Note
Chaikin Money Flow still firmly over zero, when few days remain before monthly close. Notice the closed sub-zero "pocket", like for previous correction.Let's see.
Note
Keep a look onto OBV in upcoming WEEKLY close.Note
About july monthly close, Chaikin Money Flow was confirmed above zero, after dipping under in May '19 ( more than one year ago ).See the closed sub-zero "pocket", compare with April - August '16:
That's good.
Note
Looking at upcoming weekly close (tomorrow night) , it would be interesting seeing a close ABOVE the upper BB, as that's usually a very bullish signal:Moreover, let's look for confirmation of the crossover of MA20/W (Red) on MA50/W (Blue).
Regqarding upcoming week(s), keep a look on OBV as it may breakout its own ATH again (look left):
---
All in all that's a very bullish scenario.
Just keep in mind that even in strongest bull trends pullbacks do occur.
So don't be to eager to throw your money away and await the right opportunity for entering the markets.
Note
Finally, the overall picture on weekly, with flag unfolding:And daily:
Note
Mind the fact we're talking about mid/long term trend, a local pullback il likely and probably not too far from here.Note
Awaiting some confirmation if OBV ATH breakout on weekly close.Soon to say, 3 more days to go ...
Note
Awaiting OBV ATH breakout confirmation on weekly close, tonight.Note
OBV ATH breakout achieved.Note
Imho bull trend confirmation was achieved.Bulls will keep in control as long as price will keep above MA20/W ( red ).
Have a nice ride.
Note
As usual, watch for a break-up of weekly BB as hint of upcoming impulse.Note
This is current scenario.As you see price is still within the resistance area close to the upper bound of BB.
It failed to achieve a close / break-up above BB in the last two weeks.
As you may notice it found some interim support at the upper limit of previous ascending channel (yellow).
That's the reason 10800-11000$ mark is an important support area that should hold on close.
Bulls should try to achieve a further bounce from here, otherwise price may slip again down into channel.
Anyway, macro picture will stay overall bullish as long as price will keep over the weekly BB mid-line (MA20/W), currently running at about 9200$.
Note
OBV looks healty.Clearly above last ATH.
Doublecheck on sunday weekly close as usual.
Note
Meanwhile, here i'm updating some old chart:Looks interesting ?
Note
Red bars are halvings.Disclaimer
The information and publications are not meant to be, and do not constitute, financial, investment, trading, or other types of advice or recommendations supplied or endorsed by TradingView. Read more in the Terms of Use.
Disclaimer
The information and publications are not meant to be, and do not constitute, financial, investment, trading, or other types of advice or recommendations supplied or endorsed by TradingView. Read more in the Terms of Use.