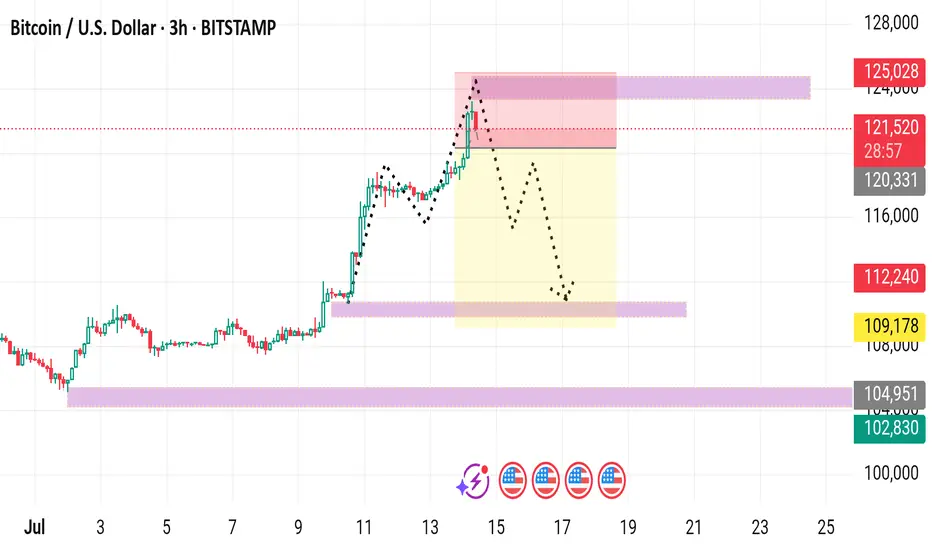
This is a 3-hour BTC/USD (Bitcoin vs. US Dollar) chart showing a bearish short-term projection after a recent bullish run. Here's a detailed breakdown:
---
📈 Current Price:
$121,482 (+1.97%)
---
🔍 Chart Highlights:
✅ Bullish Rally (before July 14):
Strong upward momentum with consolidation followed by breakout.
Recent high near $125,000 marks the local top.
📉 Bearish Reversal Zone (Red Box):
Price sharply rejected near $125,000.
Currently hovering around the red resistance zone, showing potential distribution.
---
🟡 Forecast (Dotted Black Path):
Suggests a drop from current levels toward:
First support at ~$112,240 (red zone).
Possibly lower, into the yellow range (~$109,178).
Indicates a bearish correction within the highlighted yellow zone, despite previous strength.
---
📊 Key Levels:
Level Type Comment
125,028 Resistance Local top & rejection area
121,482 Current Price at time of capture
120,331 Minor Support Near-term reaction point
112,240 Support First major downside target
109,178 Support Key structural level
104,951–102,830 Strong Support Long-term demand zone
---
📅 Events & Volatility Triggers:
Cluster of U.S. economic events (Jul 15–17) shown at the bottom — likely to increase volatility, particularly around inflation or Fed-related data.
---
🧠 Conclusion:
This chart signals a bearish short-term correction for Bitcoin:
Target zone: $112,000–$109,000
Catalysts: Overbought rejection + incoming macro data
If support around $109K breaks, next major demand zone is near $103K.
Would you like a possible trading strategy (e.g., short entry, stop-loss, target)?
---
📈 Current Price:
$121,482 (+1.97%)
---
🔍 Chart Highlights:
✅ Bullish Rally (before July 14):
Strong upward momentum with consolidation followed by breakout.
Recent high near $125,000 marks the local top.
📉 Bearish Reversal Zone (Red Box):
Price sharply rejected near $125,000.
Currently hovering around the red resistance zone, showing potential distribution.
---
🟡 Forecast (Dotted Black Path):
Suggests a drop from current levels toward:
First support at ~$112,240 (red zone).
Possibly lower, into the yellow range (~$109,178).
Indicates a bearish correction within the highlighted yellow zone, despite previous strength.
---
📊 Key Levels:
Level Type Comment
125,028 Resistance Local top & rejection area
121,482 Current Price at time of capture
120,331 Minor Support Near-term reaction point
112,240 Support First major downside target
109,178 Support Key structural level
104,951–102,830 Strong Support Long-term demand zone
---
📅 Events & Volatility Triggers:
Cluster of U.S. economic events (Jul 15–17) shown at the bottom — likely to increase volatility, particularly around inflation or Fed-related data.
---
🧠 Conclusion:
This chart signals a bearish short-term correction for Bitcoin:
Target zone: $112,000–$109,000
Catalysts: Overbought rejection + incoming macro data
If support around $109K breaks, next major demand zone is near $103K.
Would you like a possible trading strategy (e.g., short entry, stop-loss, target)?
t.me/+EQ88IkMSUvQwMGJk
Join telegram channel free
t.me/+EQ88IkMSUvQwMGJk
Join telegram channel free
t.me/+EQ88IkMSUvQwMGJk
Disclaimer
The information and publications are not meant to be, and do not constitute, financial, investment, trading, or other types of advice or recommendations supplied or endorsed by TradingView. Read more in the Terms of Use.
t.me/+EQ88IkMSUvQwMGJk
Join telegram channel free
t.me/+EQ88IkMSUvQwMGJk
Join telegram channel free
t.me/+EQ88IkMSUvQwMGJk
Disclaimer
The information and publications are not meant to be, and do not constitute, financial, investment, trading, or other types of advice or recommendations supplied or endorsed by TradingView. Read more in the Terms of Use.