⊣
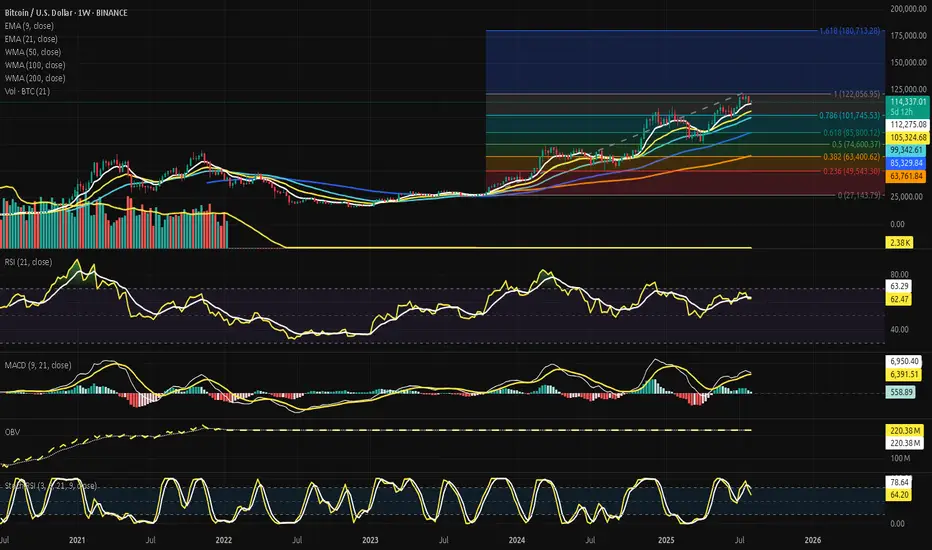
⟁ BTC/USD - BINANCE - (CHART: 1W) - (Aug 05, 2025).
◇ Analysis Price: $114,907.55.
⊣
⨀ I. Temporal Axis - Strategic Interval - (1W):
▦ EMA9 - ($112,389.19):
∴ Price action is currently positioned above the EMA9 on the 1W timeframe, reflecting ongoing bullish strength;
∴ The candle body maintains a healthy gap from the EMA9 line, indicating that short-term trend control remains with the buyers;
∴ This level also coincides closely with the upper bound of the active CME Gap, suggesting strategic confluence support in the $112.3k zone.
✴️ Conclusion: Short-term bullish structure remains intact. EMA9 acts as frontline dynamic support.
⊢
▦ EMA21 - ($105,376.55):
∴ The EMA21 remains far below the current price structure, confirming that mid-term momentum is still securely bullish;
∴ Distance between price and EMA21 reflects a sustained uptrend, but also implies vulnerability to sudden reversion if volume drops;
∴ No signs of flattening or curling - the EMA21 slope is upward, validating continuation bias.
✴️ Conclusion: Mid-range trend remains intact and structurally sound. Acts as deep dynamic support for broader bullish context.
⊢
▦ WMA50 - ($99,364.99):
∴ The WMA50 weighted average is trending upward, reflecting ongoing macro-bullish alignment;
∴ Price remains safely above it, affirming structural support and healthy trend continuation;
∴ No flattening or curve-down detected - the momentum is sustained.
✴️ Conclusion: Primary trend remains unbroken. WMA50 serves as dynamic base.
⊢
▦ WMA100 - ($85,341.14):
∴ Price remains well above the WMA100 weighted average, confirming long-term structural strength;
∴ The slope remains positive, showing no signs of decay or macro exhaustion;
∴ Acts as a foundational support level, unlikely to be challenged unless momentum is broken across multiple time frames.
✴️ Conclusion: Long-term support confirmed. Structure remains in favor of bullish control.
⊢
▦ WMA200 - ($63,767.52):
∴ The WMA200 weighted moving average holds firm as the ultimate line of structural defense in long-term cycles;
∴ Price is elevated nearly 80% above this level, affirming that Bitcoin remains far from macro breakdown territory;
∴ The slope has resumed a slight upward curve, indicating that deep-cycle accumulation zones are now behind.
✴️ Conclusion: Foundational macro support fully intact. Long-term bullish cycle structurally confirmed.
⊢
▦ VOLUME + EMA21 - (347.41 BTC):
∴ Weekly volume shows a steady decline over the past four candles, indicating weakening participation despite elevated price;
∴ The EMA21 sits just below current candle activity, suggesting that momentum is fading but not yet broken;
∴ No volume spike confirms breakout - current structure lacks conviction.
✴️ Conclusion: Volume compression persists. Trend remains, but force is thinning.
⊢
▦ FIBONACCI - (0 = $27,143.79 / 1 = $122,056.95):
⌖ 0.236 - ($49,543.30):
∴ First shallow retracement level, often reached in early corrections;
∴ Remains untouched during this cycle - represents an extreme fallback zone.
✴️ Status: Unreached - deep structural support.
⌖ 0.382 - ($63,400.62):
∴ First zone of major institutional interest;
∴ Closely aligned with the WMA200 - double confirmation as a defense line;
∴ Still far below the current structure.
✴️ Status: Untouched - possible gravity point if collapse.
⌖ 0.500 - ($74,600.37):
∴ Midpoint of the entire bull impulse;
∴ May act as magnet if the current momentum breaks down;
∴ Strongest neutral reversion zone.
✴️ Status: Unreached - mid-cycle equilibrium.
⌖ 0.618 - ($85,800.12):
∴ The golden zone - ideal level for healthy retracements in bullish trends;
∴ Not yet tested, but visible as psychological and strategic area for institutions.
✴️ Status: Unreached - primary retracement target if pullback strengthens.
⌖ 0.786 - ($101,745.53):
∴ Upper-level retracement before full price reentry into macro top territory;
∴ Very close to current price - may act as last resistance zone before all-time high break.
✴️ Status: Approaching - active resistance zone.
⌖ 1.000 - ($122,056.95):
∴ The swing high of the current macro wave;
∴ Current candles are pressing against this level;
∴ A breakout would signal macro continuation - failure could initiate retracement to 0.786 or lower.
✴️ Status: Active - pressure point of decision.
⌖ 1.618 - ($180,713.28):
∴ Full Fibonacci expansion;
∴ Represents speculative future cycle extension;
∴ Only attainable through breakout + sustained volume and ETF inflow.
✴️ Status: Untouched - long-term speculative beacon.
✴️ Conclusion:
∴ Price is now fighting just beneath (1.000 - $122K) - while leaning on (EMA9 - $112K);
∴ The macro structure remains intact, but pressure is rising between the (0.786 / 1.000) band, a known resistance battlefield;
∴ Failure to break (1.000) may activate gravitational pull toward (0.786 or 0.618) - where strength shall be tested.
⊢
▦ RSI (21, 9) - ($62.75):
∴ The Relative Strength Index remains above the 60 threshold, confirming that momentum is still bullish without entering euphoric territory;
∴ The signal line (EMA9 - $63.34), slightly above the RSI value - suggesting mild divergence and loss of acceleration;
∴ No overbought condition present, but a slow downward curve has begun from the local peak.
✴️ Conclusion: Momentum is positive but softening. Watch for confirmation of divergence or RSI breakdown below 60.
⊢
▦ MACD (9, 21, 9) - ($6,403.95):
∴ The MACD line currently sits below the signal line ($7,012.64), confirming a bearish crossover on the weekly scale;
∴ Histogram bars have turned negative, reflecting declining momentum and weakening trend strength;
∴ Despite this, the MACD remains in positive territory, indicating that the macro trend has not yet reversed - only softened.
✴️ Conclusion: Bearish momentum signal confirmed. Short-term weakness within a still intact bullish macro context.
⊢
▦ OBV (9, BB2) - ($220.38M):
∴ The On-Balance Volume indicator maintains a steady upward slope, showing continued net accumulation over time;
∴ No divergence is present between OBV and price - both remain structurally aligned;
∴ The OBV line resides within the upper half of its Bollinger Band (BB2), signaling orderly inflow rather than euphoric volume spikes.
✴️ Conclusion: Accumulation remains healthy and controlled. No warning signs from volume flow.
⊢
▦ StochRSI (3, 3, 21, 9) - (%K: 65.16 / %D: 78.96):
∴ The %K line has begun curving downward after exiting the overbought zone, suggesting momentum exhaustion;
∴ The %D line remains higher, forming a potential crossover to the downside - a classic reversion signal;
∴ Both lines still hover in the upper band, but the slope indicates a softening trend.
✴️ Conclusion: Overbought momentum is decaying. A short-term pullback or consolidation phase is likely.
⊢
🜎 Strategic Insight - Technical Oracle:
∴ EMA9 and EMA21 maintain a healthy bullish spread, preserving the dynamic trend structure without showing signs of decay;
∴ WMA50, WMA100, and WMA200 confirm full macro alignment - the base of the cycle remains strong and upward-facing;
∴ Weekly volume is compressing below its EMA21, indicating that momentum is softening despite price holding high ground;
∴ RSI (21, 9) holds above 60, preserving bullish momentum but showing early signs of curvature loss and possible divergence;
∴ MACD (9, 21, 9) has completed a bearish crossover with a negative histogram, signaling internal weakness under the surface;
∴ OBV (9, BB2) continues its upward trajectory with no volume divergence, confirming that no distribution is currently present;
∴ StochRSI (3, 3, 21, 9) is exiting the overbought zone, with %K descending and %D beginning to curve down - classic signal of momentum exhaustion.
✴️ Conclusion:The weekly structure remains bullish, but all momentum indicators are converging toward a transitional phase; Trend is intact - yet losing energy; A new directional impulse will be required to preserve the current bullish architecture.
⊢
▦ CME GAP - ($111,300 / $112,300):
⌖
∴ This gap was formed between the closing candle of Friday, July 26th and the opening candle of Monday, July 29th, on the BTC Futures contract (CME:BTC1!);
∴ The Friday close occurred near ($111,300), while the Monday open jumped to ($112,300), leaving a 1,000-point dislocation - a vacuum zone where no trades were registered;
∴ As of the current 1W candle, this gap remains completely unfilled - price has not returned to touch or shadow into this void;
∴ The gap is strategically aligned with the (EMA9 - $112,389.19) on the (1W) timeframe, forming a dual-confluence support that amplifies its gravitational potential;
∴ CME gaps of this magnitude, when left open, tend to act as attractors - especially when momentum slows and volume compresses, as currently observed in the MACD and Volume indicators.
✴️ Conclusion: The ($111,300 / $112,300) zone remains an active gravitational target;
If the current weakening of momentum persists, price may be pulled downward to close this imbalance before attempting any further upside expansion; It now acts as a pivot point between bullish continuation and corrective rebalancing.
⊢
𓂀 Stoic-Structural Interpretation:
∴ The structure does not collapse, but it no longer expands - it holds, sustained not by force, but by form;
∴ Indicators speak not of panic, nor of euphoria - they speak of pause, of a market that has climbed far and now waits for intention;
∴ The moving averages form a solid stairway, but the feet have slowed; the MACD has turned, the RSI bends gently, the volume has quieted;
∴ There is no sell-off. No rush to escape. But there is no thrust forward either;
∴ This is not weakness. It is controlled fatigue. The kind that precedes choice - will you break through, or rest and descend?
𓂀 The Stoic mind sees neither threat nor promise - only the present structure, and its silent demand for action.
∴ Hold position: Observe the slope. Momentum must return - or gravity will.
⊢
· Cryptorvm Dominvs · MAGISTER ARCANVM · Vox Primordialis ·
· Dominivm Cardo Gyratio Omnivm ·
⚚ · Silence precedes the next force. Structure is sacred · ⚚
⊢
Note
⊢𓂀 S&P 500 “Buy‑the‑Dip” Sentiment and Its Impact on Bitcoin - (Source: FXStreet):
∴ The S&P 500’s buy‑the‑dip sentiment is helping Bitcoin recover, as investors rotate capital from equities into crypto assets;
∴ Analysts believe that resilient earnings, expectations of Federal Reserve rate cuts, and broader risk-on sentiment are fueling a renewed appetite for Bitcoin;
∴ Despite inflation risks and political uncertainty, strong equity momentum and carry-over effects from the S&P 500 are supporting renewed bullish flow into Bitcoin.
✴️ Conclusion within the Arcanvm Technical Framework:
∴ The broader market sentiment (S&P 500 bounce) is bolstering investor confidence, indirectly reinforcing Bitcoin’s structure;
∴ This external impulse acts as flow-based support, aligning with the structural bullish bias observed in technicals;
∴ However, while equity sentiment helps, Bitcoin’s momentum indicators remain soft, indicating this support may be temporary or shallow.
⊢
✠
Ritvs Logicæ in Terræ Chaos;
Nihil Tumultvs. Nihil Vanitatis. Tantum Silentivm, Structvra et Exsecutio.
𓂀 Vbi Volatilitas Disciplinam Tangit - Ibi Sto.
⩘ Porta Solum Aperitur Stantibvs in Silentio.
✠
Ritvs Logicæ in Terræ Chaos;
Nihil Tumultvs. Nihil Vanitatis. Tantum Silentivm, Structvra et Exsecutio.
𓂀 Vbi Volatilitas Disciplinam Tangit - Ibi Sto.
⩘ Porta Solum Aperitur Stantibvs in Silentio.
✠
Related publications
Disclaimer
The information and publications are not meant to be, and do not constitute, financial, investment, trading, or other types of advice or recommendations supplied or endorsed by TradingView. Read more in the Terms of Use.
✠
Ritvs Logicæ in Terræ Chaos;
Nihil Tumultvs. Nihil Vanitatis. Tantum Silentivm, Structvra et Exsecutio.
𓂀 Vbi Volatilitas Disciplinam Tangit - Ibi Sto.
⩘ Porta Solum Aperitur Stantibvs in Silentio.
✠
Ritvs Logicæ in Terræ Chaos;
Nihil Tumultvs. Nihil Vanitatis. Tantum Silentivm, Structvra et Exsecutio.
𓂀 Vbi Volatilitas Disciplinam Tangit - Ibi Sto.
⩘ Porta Solum Aperitur Stantibvs in Silentio.
✠
Related publications
Disclaimer
The information and publications are not meant to be, and do not constitute, financial, investment, trading, or other types of advice or recommendations supplied or endorsed by TradingView. Read more in the Terms of Use.