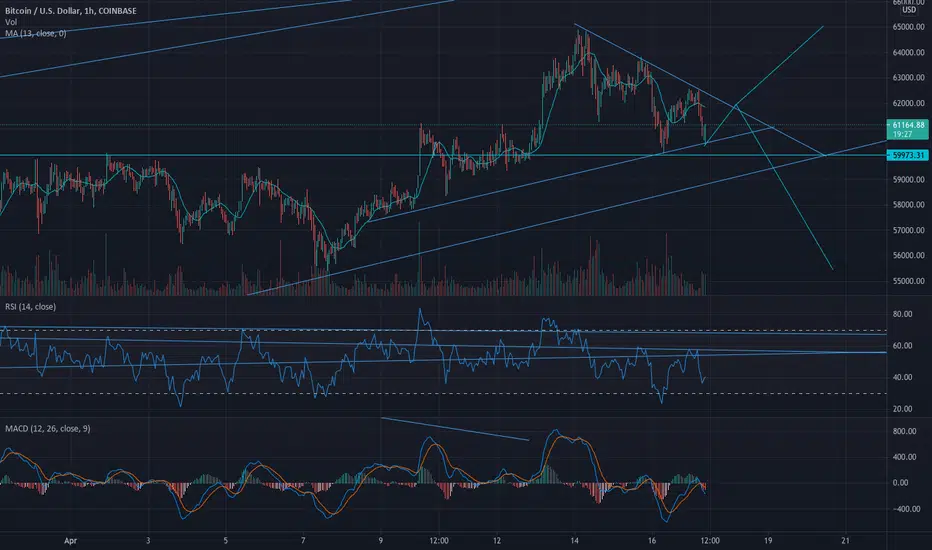
As you can see in the chart we are in a symmetrical triangle waiting to break up or down. At daily chart, RSI is testing it's previous break out point and if it bounces off from there we will see another nice bull run. Break 62k and staying above right now is very crucial to keep the bull momentum. Otherwise we are seeing a downside to 58 -59k range.
Disclaimer
The information and publications are not meant to be, and do not constitute, financial, investment, trading, or other types of advice or recommendations supplied or endorsed by TradingView. Read more in the Terms of Use.
Disclaimer
The information and publications are not meant to be, and do not constitute, financial, investment, trading, or other types of advice or recommendations supplied or endorsed by TradingView. Read more in the Terms of Use.
