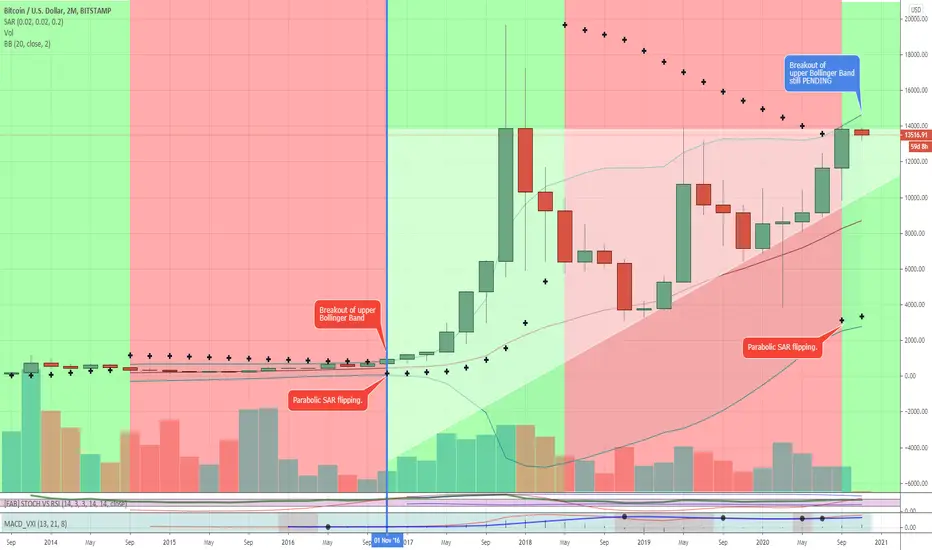
This is a (huge) 2-month timeframe chart. I think it conveys a simple yet quite effective view on the trend.
Watch Parabolic SAR and Bollinger Bands.
We've an extremely bullish scenario above the 10.000$ mark.
Upper BB breakout and rising volume needed.
Looking forward to these last two months of 2020.
Watch Parabolic SAR and Bollinger Bands.
We've an extremely bullish scenario above the 10.000$ mark.
Upper BB breakout and rising volume needed.
Looking forward to these last two months of 2020.
Note
Previous analysis:
Note
And:
Note
And:
Note
Speaking of current scenario, i've marked on the below chart the 3 most representative candles BREAKING upper Bollinger Band on a monthly close.That's basically:
* March, 2013
* May, 2016
* October, 2020
Both 2013/2016 candles marked a continuation / acceleration in uptrend.
Interestingly enough the 2016 candle preceeded a Parabolic SAR reversal.
Something we just saw in october 2020.
So far so good.
Kepping in mind that's about medium term outcome.
Note
Price reached upper BB zone ( about 15.000$ ).Note
Dealing with trendline (resistance):Note
Zooming:Trying to confirm an ascending triangle.
Needs volume and not much time left.
A rejection here would be troublesome, bitcoin you'd better push here ...
Note
Ugly rejection if confirmed within one hour.Be very careful under support ( about 15.500$ ).
Note
Maybe it go through 16.000$ ... At last.Eyes on close.
Note
The whole picture, as of now.Boom or doom.
Note
Boom.Now we need a confirmation on monthly close.
Note
Impressive.Still it has to be confirmed on november and december close.
Note
Same, on monthly:Let's see next week, that's crucial.
Note
Mind the fact Bitcoin never managed tp close such a tall marubozu candle.So far.
Note
It managed to do it.Tallest candle ever on november 2020.
Note
Today our ascending triangle reached its natural target in the 23.000 to 24.000$ area. It was a nice ride, up from 13.000$.Now looking forward to monthly and yearly close.
Disclaimer
The information and publications are not meant to be, and do not constitute, financial, investment, trading, or other types of advice or recommendations supplied or endorsed by TradingView. Read more in the Terms of Use.
Disclaimer
The information and publications are not meant to be, and do not constitute, financial, investment, trading, or other types of advice or recommendations supplied or endorsed by TradingView. Read more in the Terms of Use.