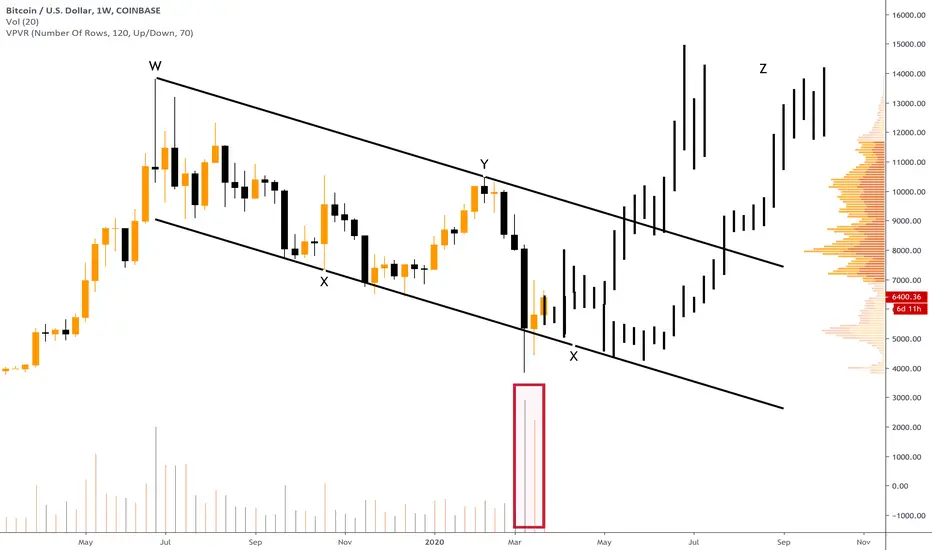
Previous two weeks were VERY volatile, volumes were huge, but that's not a secret for anyone. Both weeks closed inside the bullish flag. So, we have two options:
 BTC trades in the range between $6300 and $6000, then heading towards the upped border of the channel for some time - then broke one, which leads to the "Z" point.
- BTC trades in the range between $6300 and $6000, but then goes lower in order to re-test the support of the channel once again - then goes upwards and break through the resistance.
Klondike Official Links:
Website:
klondikepro.com/
Public Telegram Channel:
t.me/CryptoKlondike
Twitter:
twitter.com/Robert_Klondike
Trade on Bybit with us:
partner.bybit.com/b/6694
Website:
klondikepro.com/
Public Telegram Channel:
t.me/CryptoKlondike
Twitter:
twitter.com/Robert_Klondike
Trade on Bybit with us:
partner.bybit.com/b/6694
Related publications
Disclaimer
The information and publications are not meant to be, and do not constitute, financial, investment, trading, or other types of advice or recommendations supplied or endorsed by TradingView. Read more in the Terms of Use.