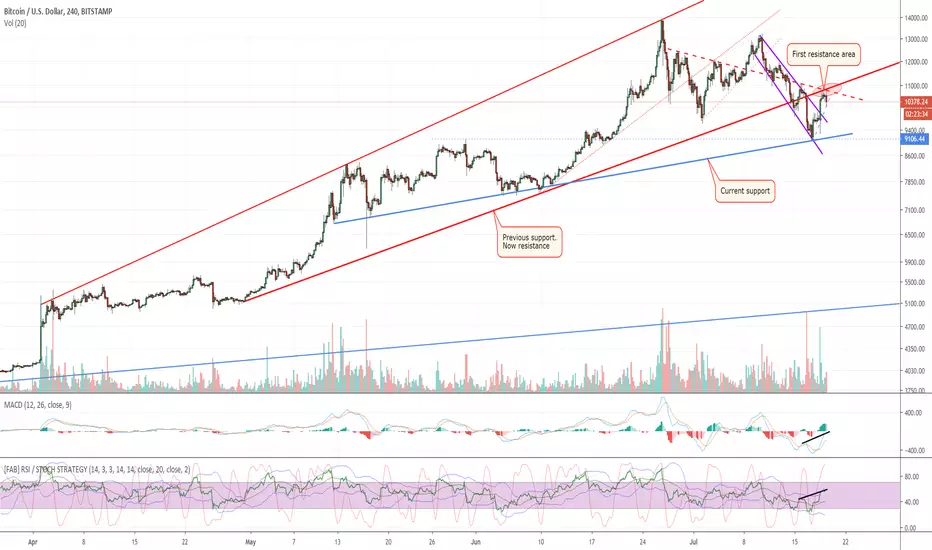
Risky area. Spring support is gone and a Chuvashov fork is possible if current support breaks, hence a break under 9000$.
So far bulls managed to get a pullback ( technical rebound ) to previous support, but now the broader 11k area is resistance.
Bias is actually bearish.
Short time bulls may still try to find an inverted H&S with a right shoulder above 9800/9900$, but it's soon to place a bet on that.
Anyway, unless they manage to recover well above 11k before sunday weekly close i think more downside action is likely.
Note
Medium term picture:Bulls should manage to get a weekly close over well 10800$ in order to negate that RED 1 count. If they fail to the impulse started back in february will pause and/or likely finish.
So sunday weekly close is crucial.
Note
Price trying to do some inverted H&S.High resistance area ahead, above FIB 0.618.
Doubt it will break through, BUT if it does it will be rather interesting.
Note
Interestingly enough this "candidate" H&S should have basically the same neckline as the previous one ( which went through after a pullback ).Note
Trying to break up 11k.Note
Pirec was clearly rejected by previous support, now resistance.No surprise so far.
Bulls *may* have a last chance, meaning a broader inverted H&S ( or ascending triangle ). This as long as price keeps over ( roughly ) 9900-10000$.
Failing that i think bears will take over.
We'll see.
Note
Note
Pretty interesting setup.So far BTC didn't lose its key support on daily close.
If it will manage to stay above it on today close it may rebound.
Otherwise i'd say 9400$ would be very likely and -breaking that- sub 9000$.
Anyway there's a possible falling wedge insisting on this price action, so a rebound from 8800-8500$ area is highly likely unless wedge support is broken on volume.
Note
Price closed over support.Now there's a decent chance of a morning star on daily, but resistance ( upper bound of the wedge ) should break.
If so we'll have a good rebound.
Note
Morning star failed.It's still bulls vs bears, crossroads ahead.
Note
Failing the breakout FIB 0.5 and MA100 are likely to provide (next) support.Note
Falling wedge was confirmed and already got to target ( and dynamic resistance ).We have now a pullback to MA100/D ( green line ).
This is the first true test for this key support, dating back to february 2019.
Note
Note
We have to thoughtfully evaluate bulls strength here, as recently they have lost some steam by breaking down a couple short term supports and failing to set a HH. Anyway, this was expected.Now we have a couple slight bullish divergences on RSI /MACD, yet both may still be canceled if price breaks support ( BLUE ).
So keep an eye on MA100 ( GREEN ) and medium term support ( BLUE ) and watch for some reaction from there. Ideally from there you may try to catch a rebound to dynamic resistance, but it's risky so use a tight SL.
*BUT*, mind the following: even in case of a rebound, unless that resistance is pierced we may end up having a H&S or descending triangle picture.
So don't risk more than needed and use a SL.
Worst case ?
We may have a breakdown of both MA100 and support.
Not much likely to happen, but in that case don't panic as it would be actually healthy for the medium term.
Mind the fact that just in case 7200 to 8600$ range is a strong BUY area in my opinion.
Take care and good luck.
Note
Bounce over MA100.First resistances sitting at 10560, 10900$.
If you're in for an opportunistic Long swing be sure to apply a SL.
Bears should be assumed still in control at least till dynamic resistance ( RED ) is pierced in volume. Only that would change the picture.
Note
The above mentioned levels ( 10560, 10900 ) proved to be good take profit levels.So what now ?
Price still wavering in proximity of MA100, with volume still degrading.
Still weak under 10600$.
Noticeable price congestion within the lower half of the Bollinger bands.
It means a strong movement is to be expected relatively soon.
Macro scenario is still unchanged.
Bears stay in control unless bulls manage to recover any soon above about 10900$ ( BB middle line ) and then te critical 11500$ ( dynamic resistance ) area.
About 8 days ago i warned about the risk of a descending triangle or a H&S.
Considering the latter option, we have seen the right shoulder painted.
This alone should be considered a warning sign.
Note
Weekly MACD.Caution.
Note
I think we'll have a volatile weekend ahead.Note
Down 700$ already, unsurprisingly.First support was cleared, let's see.
Note
Floor of the descending triangle reached.If it breaks next stop near middle of BB ( slightly above 9000$ ).
Otherwise it may do a technical rebound, but the overall scenario won't change unless the triangle is broken out to the upside.
Currently bears are in control.
Note
Last, but not least.If you wish to capitalize the 8% drop across the latest 12 hours and/or try ride some hypothetical technical rebound DON'T FORGET TO SET A STOP LOSS.
Good luck.
Note
Rebound on its way.Watch for 10100-10200$ as area of resistance.
MA100/D is now resistance, whereas it was support before.
Don't forget to protect your profit accordingly.
Note
10200$ area reached.Now we'll see if bulls have some strength or not.
Note
Bulls scored a point by breaking out MA100/D again, on decent volume.Yet bears are still in control.
This as long as major dynamic resistance ( red ) stays in play.
On a breakout the outlook would change.
Note
Taking some profit from here and up ( long'd the rebound ).Note
Rejected by dynamic resistance, price found some quick support on MA100/DThese lines are converging, we'll see an abrupt move when either gets broken on volume.
Note
Bulls may try for here.Note
*IF* bulls can push price towards to dynamic resistance (RED) -AND- break it out to 10900$ we may have an inverted H&S forming here.Till them bears are still in charge.
We'll see.
Note
We're still in a congestion phase.Bullish over 11000$, bearish under 9700$.
Note
Note
Still in range.Awaiting breakout.
Note
Previous support is gone.
*BUT* tomorrow we may have a TD count=9 on daiy, so i'd look out for some reaction between here and solid blue support.
Failing that price is likely to test the baseline of yellow triangle.
Note
Testing bottom of yellow descending triangle already.Note
Brace. Bears will try the breakout now.Note
Here it isdown 500$ already.
Looking at 8500-8700$ area.
Note
Bears indeed "raised their head", hence the purpose of this post is fulfilled.Iwas waiting this triangle to break, it did at last.
Look for next analysis soon.
In my vision we're just starting to form a higher low from here, bull trend is not over.
I'm a buyer under 8500$ down to 7200$ eventually.
Why? I'll tell you if you find it interesting.
Note
For now: 8500$, FIB 0.5 area was the first milestone.It has been reached.
Note
Buy the dips methodically along the way down.Be patient and good luck, it's going to rebound multiple times.
Note
Peeking at next chapter.Trade closed: target reached
First target reached, yet bears may rage till well under 8000$.Note
Next chapter:
Disclaimer
The information and publications are not meant to be, and do not constitute, financial, investment, trading, or other types of advice or recommendations supplied or endorsed by TradingView. Read more in the Terms of Use.
Disclaimer
The information and publications are not meant to be, and do not constitute, financial, investment, trading, or other types of advice or recommendations supplied or endorsed by TradingView. Read more in the Terms of Use.