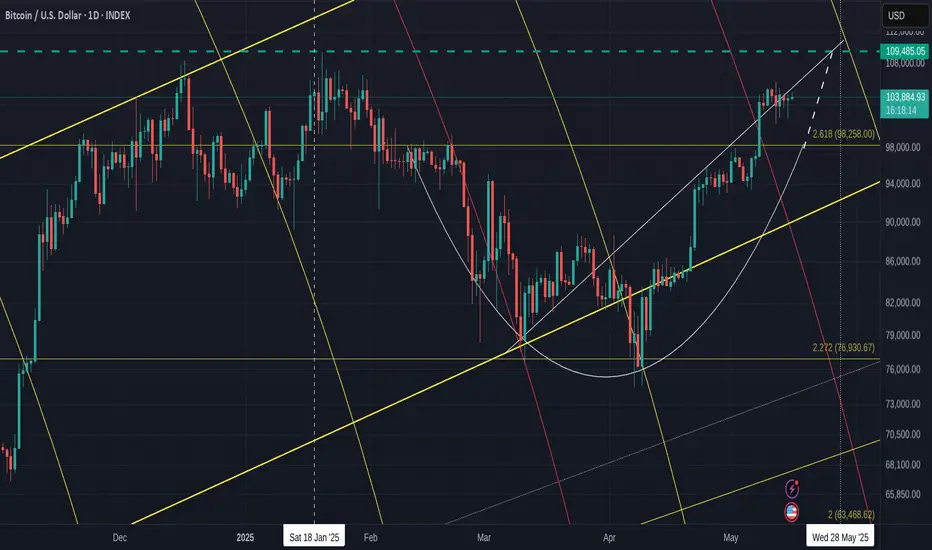
First Off - Sorry for all the lines on the chart but EVERY one is very relevant to what is happening right now.
The Dashed Blue Horizontal line is the current ATH line. possible Resistance.
The 2.618 Fib extension has not yet been tested as support. This could happen still, at any point till end of month and is around the 98K usd zone.
PA has Ranged through the Local rising line of support, as if it no longer existed, which was a little surprising given the strength that PA has still. There maybe some uncertainty in the air.
PA is above the neckline of the Cup pattern it printed and, again, it would not be unusual to see PA come back down to test this Neckline as support, which is on that 2.618 Fib extension.
The Bold Yellow line is Long Term Support line since 2015, showing that Bitcoin PA is in the Lower side of a Long Term ascending channel, with plenty of room to rise,
PA has a lot of inert strength right now, so, we may not see this retest happen.
We just have to wait.
BUT you can see that Rising dashed line, the extension of the Cup pattern.
PA may range across into this and bump into it next week. If it acts as support again, PA will then be pushed into a tight Squeeze against the other rising line of support, with an Apex on the current ATH line.
PA ALWAYS REACTS BEFORE THE APEX
All that points towards some Volatile times next week if PA remains in this area.
The other descending line there is a 618 Fib Circle. You can see that 98% of the Time, PA is effected by these.
All this shows us 4 points of resistance, in the same Zone, All Next week and PA will Either Shoot through it with a Big push, Or we may see PA Drop back down. The Big question being, how Far ?
We do not want to loose the 2.618 Fib ext at 98K
But what else can we look at. ?
The RSI DAILY
https://www.tradingview.com/x/jYvsxSqK/
This is still up high in the near Over Bought zone. It can range up here for extended periods but this is something we should be aware of as the possibility of a drop does exist.
On the weekly, RSI has room to move higher & the 4 hour is in neutral zone, again with ability to push higher.
The MACD DAILY
https://www.tradingview.com/x/XnbCrcmf/
This is once again curling over and about to test the red signal line as support.
On a 4 hour chart, the MACD is down on Neutral line, giving it strength to push higher and if that continues, we will see the yellow MACD line bounce off the Red signal line on the Daily chart.
Once again, Look at the Histogram and the similarity to the area that the Arrow is pointing at.
We could repeat this but on a larger scale. We have to wait and see if this happens.
But also note how there was a Visit into a red Histogram ( for 4 days ) before the bigger push and I remind you about what has been said above.
So, what else can we look at that may offer some ideas ?
The Chart below is the 4 main Crypto Dominance charts by market Cap - 4 hour
BTC.D - ETH.D
OTHERS.D - USDT.D
( OTHERS = Top 125 Coins MINUS Top 10 by Market Cap) Mid to Low cap
https://www.tradingview.com/x/tU5CvcXV/
We have recently seen a Drop in Bitcoin dominance, giving the ALTS some time to push higher. This is seen with the BTC.D dropping and the ETH.D and OTHERS.D rising
Also note how USDT.D Dropped, showing that stable coins were being exchanged for Crypto,
And as we see now, we have the possibility of BTC.D being rejected by its 50 SMA ( Red)
ETH.D is above its 50 SMA, showing it had a good push and may get support if PA drops
OTHERS.D has already fallen below its 50 SMA, showing a brutal sell off, rapid profit taking.
That is the world of ALTS.
In the last 48 hours, we saw a return for Bitcoin as it rose from a shallow Low in its Range. This was enough to cause a sell off of the ALT coins as we see in the Drop in Others.D
ETH however, remains in a range with obvious intention to continue higher if the market allows.
Lastly, we can compare Bitcoin to the other Markets
Bitcoin - CFD GOLD
DXY - S&P500
https://www.tradingview.com/x/xjRdTBGh/
Bitcoin has performed well. It has reclaimed some position on Gold recently while it climbed alongside the S&P
We can also see how BTC climbed while DXY dropped.
This highlights some Flaws in using the BTC USD pair to judge the success of BTC but this is explaned better in another post. But in short, If the $ looses Value and your BTC USD pair appears to climb, theg ain is lost as the $ is worth less.
Use BTC XAUT pairs. Bitcoin Gold Pair - Historically, GOLD looses little Value by comparison. So when Bitcoin gains against Gold..It is WIN WIN
https://www.tradingview.com/x/FhE7wktf/
So, in conclusion, we see Bitcoin under some pressure to avoid Lower or sharper Drop in the short tern.
The Lower Timeframes show us that BTC has the ability for a Continued Range but with caution.
We see ETH ( and larger Alts ) intent on remain in the game now they have had a small glimpse of Gains
And we see that Mid and Lower Cap Alts are mostly just money makers providing you play the game right. And that game may have some more time if Bitcoin Stumbles in the next 7 days.
And that possibility does exist.
Today is crucial in many ways and will set the tone for the following week.
There is Financial Data being released by the USA today and if unfavourable, we may see some sharp moves.
And ,Longer Term VERY BULLISH - I HOLD AND CONTINUE TO BUY WHEN I CAN ON SPOT ORDERS
I hope this helps and I am grateful for comments
Nothing to be taken as Financial advice.
I will always say
"Only invest what you can afford to loose. When you are ready, take out your original investment. This way, it is only your profit that is at risk"
THAT is Financial advice
I will always say
"Only invest what you can afford to loose. When you are ready, take out your original investment. This way, it is only your profit that is at risk"
THAT is Financial advice
Disclaimer
The information and publications are not meant to be, and do not constitute, financial, investment, trading, or other types of advice or recommendations supplied or endorsed by TradingView. Read more in the Terms of Use.