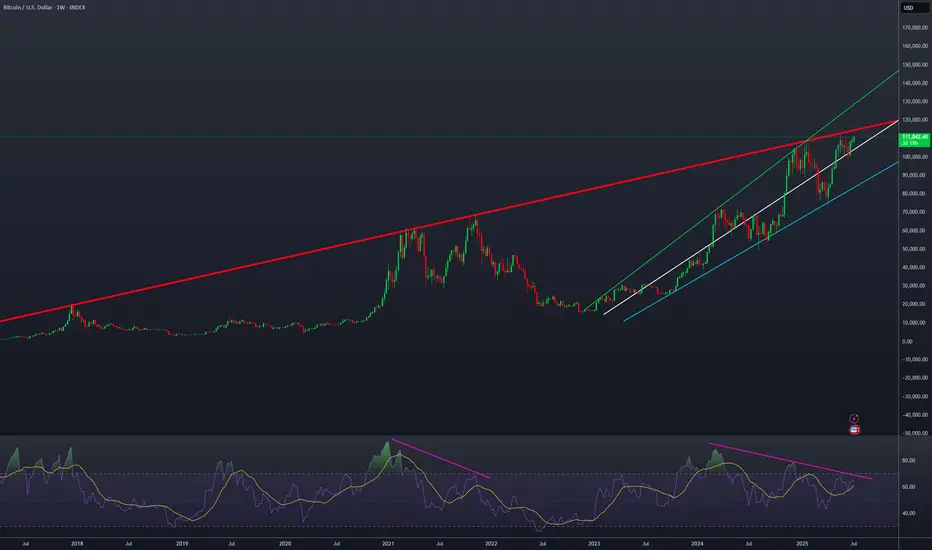
Straight forward idea. The green line represents this cycle's sellers. The blue line has been this cycle's buyers. The red line has formed across multiple cycles and has yet to break. If the blue line breaks, the cycle is likely over. The white line is just an approximate mid-point between the green and blue. Also, seeing RSI bearish divergences is certainly less than ideal.
My longer term bags wants this red line break, but the price action could certainly look better. It could be that bitcoin dominance should be much lower for there to be a cyclical top. You could argue speculative alts rising in parabolic fashion creating a bubble is what causes the cycles to be over, but that could be a false assumption.
My longer term bags wants this red line break, but the price action could certainly look better. It could be that bitcoin dominance should be much lower for there to be a cyclical top. You could argue speculative alts rising in parabolic fashion creating a bubble is what causes the cycles to be over, but that could be a false assumption.
Disclaimer
The information and publications are not meant to be, and do not constitute, financial, investment, trading, or other types of advice or recommendations supplied or endorsed by TradingView. Read more in the Terms of Use.
Disclaimer
The information and publications are not meant to be, and do not constitute, financial, investment, trading, or other types of advice or recommendations supplied or endorsed by TradingView. Read more in the Terms of Use.