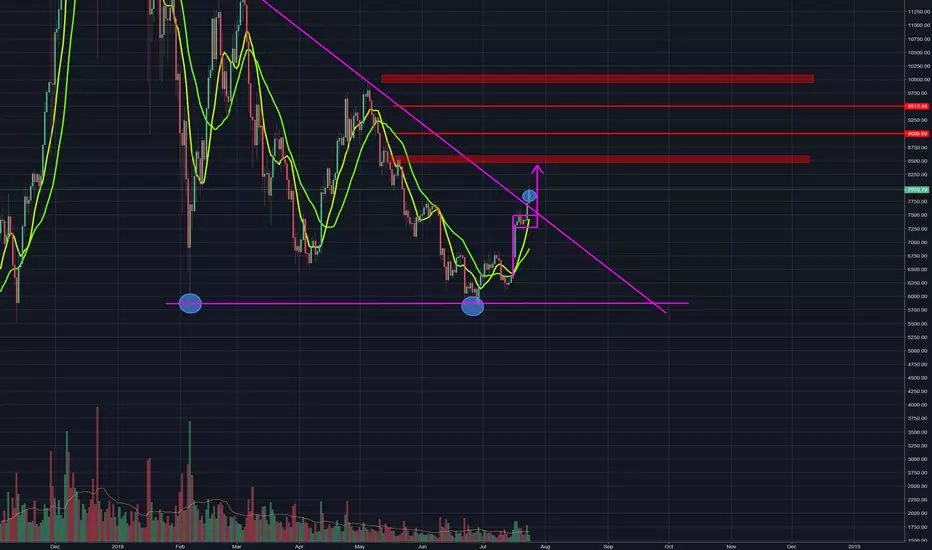
Its true, the double bottom has been confirmed, and we can officially say that it is bitcoin season and that this bull market is strictly a bitcoin bull market. I did hear some news only recently about an ETF but I do not know anything about it. Bitcoin has broken 8000, but it needs a significant break. I do not have the volume profile up, but I do know that there is a lot less transaction history in this area, so a significant break of 8000 would take it to the price objective of the bull flag which is roughly 8400. The 9-day crossed the 18-day MA a while ago which is another bullish sign. The price objective of the inverse head and shoulder has been officially hit as well!
TO lock in the break of the purple resistance line, I would like to see the bull flag's price objective hit.
Key Points:
1.) The Bear market looks to be over, however, I would like to see the price move further for me to say 100% this could still be a false break (extremely doubtful).
2.) The MA's have crossed into bullish territories, because the price of bitcoin has crossed the 200 MA with ease, and both the 9 and the 18 day MA's crossed.
3.) I have highlighted the points of resistance on bitcoin, the red bars and lines.
Best of Luck Trading and for those following me I hope you guys have taken my information well!
Note
I have drawn two tentative trendlines, please note that this cannot officially be called trendlines because trendlines require at least three touches to be an officially confirmed trendline.Note
Previous Analysis:
Note
The bitcoin was just shy of its bull flag price objective, by roughly, 50 dollars, that could be because of my inaccurate measurement, however, it did drive into the mid 8000. There could be a possible bearish divergence in the 4 hour time frame, however, that divergence would only be valid if the 4 hour chart passes the trough, which is the green line at the bottom. In addition, it is in the 4 hour time frame, which I do not believe would be enough to negate the daily divergence that occurred in the inverse head and shoulder.
I do believe that bitcoin will be following a path similar to my yellow line more possibly at a higher point, so I believe there will be another short term bull flag at a higher price point or it is possible that bitcoin makes a small movement down to test the light blue trendline. In addition, I believe that the RSI will probably follow something similar to the yellow line I have drawn at the bottom and if a bearish divergence occurs, then it will probably stay at this price point for a longer period of time to consolidate.
Disclaimer
The information and publications are not meant to be, and do not constitute, financial, investment, trading, or other types of advice or recommendations supplied or endorsed by TradingView. Read more in the Terms of Use.
Disclaimer
The information and publications are not meant to be, and do not constitute, financial, investment, trading, or other types of advice or recommendations supplied or endorsed by TradingView. Read more in the Terms of Use.