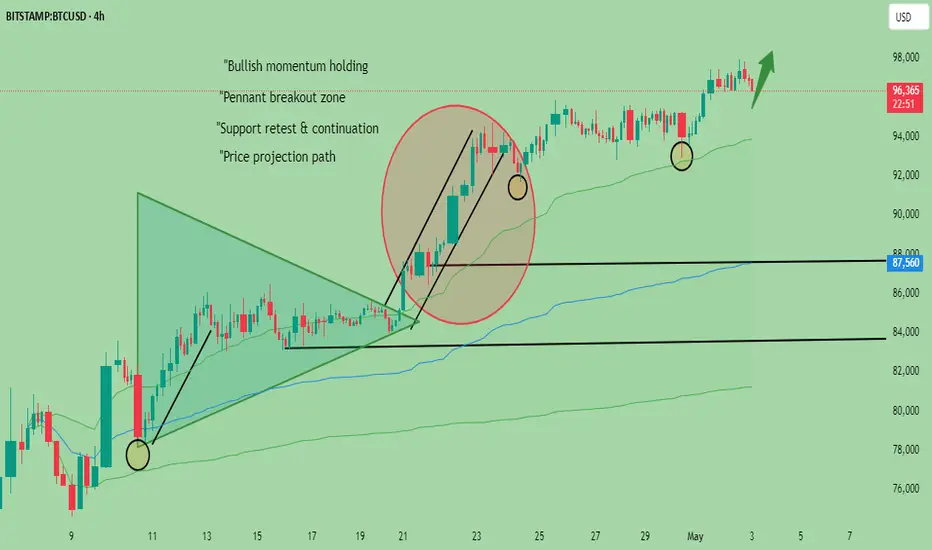
This 4-hour BTCUSD chart highlights a clean bullish breakout from a pennant pattern, followed by consolidation and continuation. The recent price action shows higher lows and strong support along the trendline. The chart outlines key breakout zones, support levels, and a projected upward move, based on price structure and momentum.
Disclaimer: This analysis is shared for educational purposes only and does not constitute financial advice.
Disclaimer: This analysis is shared for educational purposes only and does not constitute financial advice.
Trade active
Update (May 3, 2025): Price is currently holding above $96,000 after a successful retest of the breakout level. As long as the trendline holds, the bias remains bullish with potential to test higher resistance zones. Monitor volume and momentum for confirmation.FOR EDUCATIONAL PURPOSE ONLY.
Use risk Management properly.
Trade closed: target reached
BTC Trade Closed – Bullish Signal SuccessWe shared a bullish signal on BTC at $96,000, and it just hit $103,000 – trade closed with a strong move to the upside!
Want more profitable setups like this?
Follow us, join our community, and stay updated with our TradingView posts – all in line with TradingView's rules.
More trades coming soon!
The information and publications are not meant to be, and do not constitute, financial, investment, trading, or other types of advice or recommendations supplied or endorsed by TradingView.
Related publications
Disclaimer
The information and publications are not meant to be, and do not constitute, financial, investment, trading, or other types of advice or recommendations supplied or endorsed by TradingView. Read more in the Terms of Use.
Related publications
Disclaimer
The information and publications are not meant to be, and do not constitute, financial, investment, trading, or other types of advice or recommendations supplied or endorsed by TradingView. Read more in the Terms of Use.