1. Bearish Rejection Zone
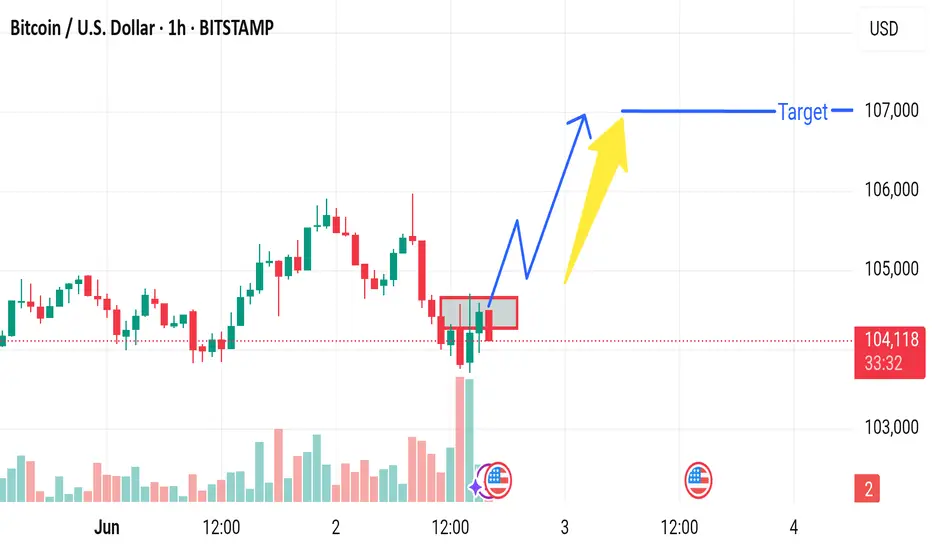
The red box highlights a consolidation/resistance zone.
BTC is struggling to break and close above this area.
Multiple candle wicks into the zone suggest seller strength.
---
📉 2. Volume Weakness
The recent upward candles show lower volume compared to the selling candles before it.
This indicates that the buying pressure may be weak, lacking momentum for a breakout.
---
🕳️ 3. False Breakout Trap Risk
A fakeout above the resistance box is possible if big players trigger buy orders and then reverse the market, trapping retail traders.
---
🟠 4. Bearish Divergence (if confirmed by RSI or MACD)
Without indicators shown, if momentum indicators like RSI/MACD display divergence (price up but momentum down), it’s a bearish signal.
Disclaimer
The information and publications are not meant to be, and do not constitute, financial, investment, trading, or other types of advice or recommendations supplied or endorsed by TradingView. Read more in the Terms of Use.
Disclaimer
The information and publications are not meant to be, and do not constitute, financial, investment, trading, or other types of advice or recommendations supplied or endorsed by TradingView. Read more in the Terms of Use.