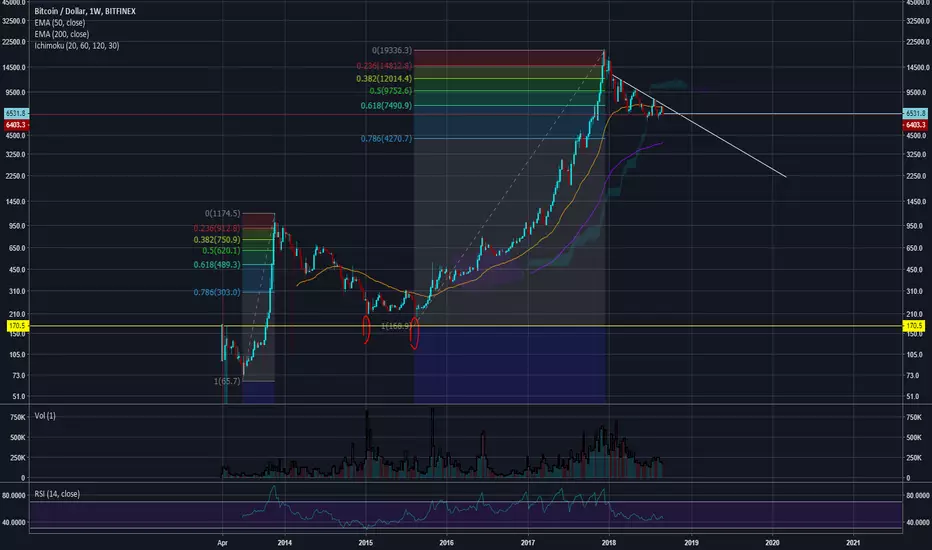
In this picture I'm showing the 2014 bubble and how it retraced to the gray area of the Fibonacci Retrace indicator. Go and look at any bubble from any point in time and they behave the exact same way. What this means is that Bitcoin has a lot further to fall, potentially even to ~$1.5k. Personally my bet is around $2.5k but only time will tell.
I've attached charts from the 99-00 tech boom/crash with their Fib retracements to support my claim that, like every other bubble, BTCUSD will retrace to the gray box. Bitcoin is not impervious to total collapse and the fact that people think it is simply validates my opinion that this has a long way to go.


I've attached charts from the 99-00 tech boom/crash with their Fib retracements to support my claim that, like every other bubble,
Disclaimer
The information and publications are not meant to be, and do not constitute, financial, investment, trading, or other types of advice or recommendations supplied or endorsed by TradingView. Read more in the Terms of Use.
Disclaimer
The information and publications are not meant to be, and do not constitute, financial, investment, trading, or other types of advice or recommendations supplied or endorsed by TradingView. Read more in the Terms of Use.