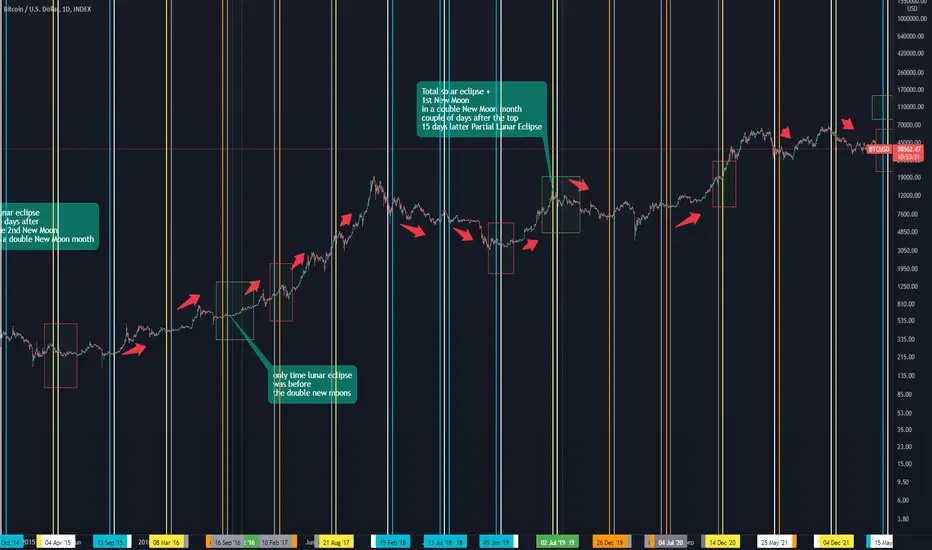
So a little bit of legend here to explain what's what on the chart
green dotted lines are full moons in the same month, i'll call them double new moons
in areas where eclipses overlap them I've noted the section with a text
blue lines are partial solar eclipses
white lines are full lunar eclipses
grey lines are partial lunar eclipses
yellow lines are total solar eclipses
brown lines are annular solar eclipses
as you can see here there is a trend in order solar and lunar eclipses appear
it's starting of with lunar/solar, lunar/solar....
green rectangles are where the double new moons are
red rectangles are changes of an trend in order of eclipses
as you can see we are continuing with solar/lunar, solar/lunar
The goal is to try to spot potential trend reversal indicators and to see the way price is following that trend...
Disclaimer
The information and publications are not meant to be, and do not constitute, financial, investment, trading, or other types of advice or recommendations supplied or endorsed by TradingView. Read more in the Terms of Use.
Disclaimer
The information and publications are not meant to be, and do not constitute, financial, investment, trading, or other types of advice or recommendations supplied or endorsed by TradingView. Read more in the Terms of Use.