Long
BTC USD short term reversal
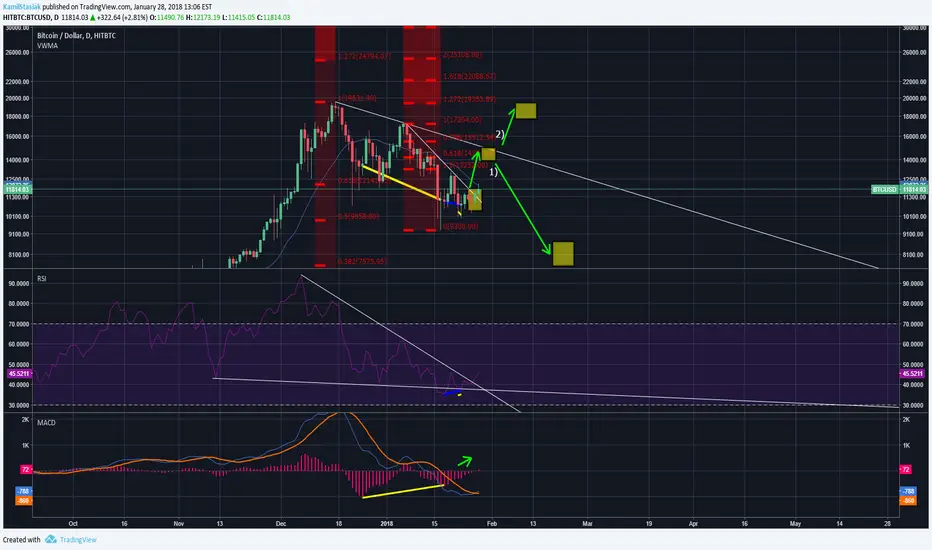
I have drawn this chart 3 days ago and decided to post as it seems to be some proof for Bitcoin to reverse its trend to bullish (atleast short term)
8100$ is still valid in mid/short term

- There are several divergences on different intervals on RSI and both MACD, and I guess many more indicators too.
- Both expiration of contract futures at CBOE on 17 of JAN and at CME on 26 of JAN nicely came together with very beginning of bullish price reversal.
8100$ is still valid in mid/short term
Disclaimer
The information and publications are not meant to be, and do not constitute, financial, investment, trading, or other types of advice or recommendations supplied or endorsed by TradingView. Read more in the Terms of Use.
Disclaimer
The information and publications are not meant to be, and do not constitute, financial, investment, trading, or other types of advice or recommendations supplied or endorsed by TradingView. Read more in the Terms of Use.