# BTCUSD COMPREHENSIVE TECHNICAL ANALYSIS
**Asset**: Bitcoin / US Dollar (BTCUSD)
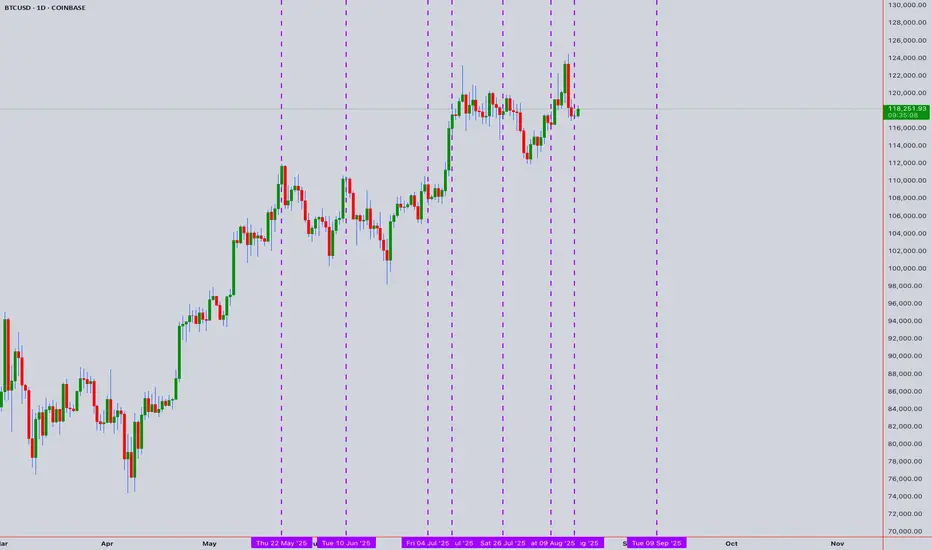
**Reference Price**: $117,498.30 (August 16th, 2025)
**Analysis Date**: August 17, 2025
**Market Cap**: ~$2.3 Trillion (estimated)
## EXECUTIVE SUMMARY
Bitcoin is experiencing a critical technical juncture following a sharp reversal from recent all-time highs above $124,500. The current price action suggests a complex corrective phase within a larger bullish structure. Multiple analytical methodologies indicate potential for both short-term volatility and longer-term continuation of the secular bull market.
---
## 1. ELLIOTT WAVE ANALYSIS
### Super Cycle Perspective (Monthly/Yearly)
**Major Degree Classification**:
- **Super Cycle**: Wave (III) in progress since 2020 lows
- **Cycle Degree**: Wave III of (III) - the heart of the bull market
- **Primary Degree**: Wave (5) of III nearing completion
- **Current Position**: Complex corrective phase after new highs
### Primary Wave Structure (Weekly/Daily)
**Wave Count Analysis**:
- **Wave (1)**: Completed at $73,800 (March 2024)
- **Wave (2)**: Corrective decline to $49,000 (August 2024)
- **Wave (3)**: Extended impulse to $124,597 (August 2025)
- **Wave (4)**: Current corrective phase in progress
- **Wave (5)**: Projected final push higher
### Current Corrective Structure (Daily/4H)
**Wave (4) Analysis**:
- **Pattern Type**: Complex corrective structure (Double Zigzag W-X-Y)
- **W Wave**: Sharp decline from $124,597 to $113,500
- **X Wave**: Corrective bounce to $119,800 (completed)
- **Y Wave**: Currently unfolding, targeting $110,000-$114,000
**Internal Structure**:
- **Subwave a**: Completed at $113,500
- **Subwave b**: Bounce to $119,800 (current level vicinity)
- **Subwave c**: Expected decline to complete Wave (4)
### Elliott Wave Projections
**Wave (4) Completion Targets**:
- **Shallow Correction**: $114,000-$116,000 (38.2% retracement)
- **Moderate Correction**: $110,000-$113,000 (50% retracement)
- **Deep Correction**: $105,000-$108,000 (61.8% retracement)
**Wave (5) Targets** (after correction completion):
- **Minimum Target**: $135,000-$140,000 (equality with Wave 1)
- **Extended Target**: $155,000-$165,000 (1.618 extension)
- **Extreme Target**: $200,000-$220,000 (2.618 extension)
### Time Analysis
**Wave (4) Duration Expectations**:
- **Typical Duration**: 21-34 days (based on Wave (2) relationship)
- **Current Progress**: Day 7 of correction (started August 12)
- **Completion Window**: August 25 - September 5, 2025
**Wave (5) Timeline**:
- **Duration**: 45-89 days (Fibonacci relationship)
- **Completion**: December 2025 - February 2026
### Invalidation Levels
- **Critical Support**: $95,000 (breaks Wave (1) high)
- **Alternate Count**: Below $95,000 suggests larger degree correction
---
## 2. HARMONIC PATTERN ANALYSIS
### Active Harmonic Formations
**Bearish Deep Crab Pattern (Daily)**
- **X to A**: Reference leg from $49,000 to $124,597
- **A to B**: 0.618 retracement targeting $119,200
- **B to C**: 0.886 retracement to $121,800
- **C to D (PRZ)**: 2.24-3.618 extension targeting $110,000-$114,000
- **Current Status**: C to D leg in progress
- **Pattern Completion**: Expected within 1-2 weeks
**Target Projections** (after pattern completion):
- **T1**: $120,000 (38.2% CD retracement)
- **T2**: $125,000 (61.8% CD retracement)
- **T3**: $130,000 (78.6% CD retracement)
**Bullish Bat Pattern (4-Hour)**
- **X to A**: Swing high to swing low establishment
- **A to B**: 0.382-0.500 retracement at $118,500
- **B to C**: 0.382-0.886 retracement at $115,200
- **C to D**: 0.886 XA retracement targeting $112,500-$114,000
- **Completion Status**: Near PRZ zone
**ABCD Pattern (1-Hour)**
- **AB = CD Structure**: Equal wave decline pattern
- **A to B**: Initial decline $124,597 to $119,500
- **B to C**: Corrective bounce to $122,100
- **C to D**: 127.2-161.8% extension to $113,500-$115,000
- **Current Status**: Near completion of D point
### Gartley Pattern (Weekly)
**Long-term Bullish Gartley**:
- **X Point**: $15,500 (2020 low)
- **A Point**: $69,000 (2021 high)
- **B Point**: $15,500 (2022 low) - 0.786 retracement
- **C Point**: $124,597 (current high area)
- **D Point Projection**: $85,000-$95,000 (if pattern completes)
**Note**: This larger pattern suggests potential for deeper correction if activated
### M & W Patterns
**M-Top Formation (Daily)**:
- **Left Peak**: $124,597 (August 12, 2025)
- **Valley**: $113,500 (August 14, 2025)
- **Right Peak**: Potential retest of highs
- **Neckline**: $113,500 support area
- **Break Target**: $102,000-$105,000
**W-Bottom Potential (4-Hour)**:
- **First Low**: $113,500 (established)
- **Second Low**: $114,000-$116,000 (current formation area)
- **Neckline**: $119,800-$121,000
- **Breakout Target**: $125,000-$128,000
---
## 3. WYCKOFF METHOD ANALYSIS
### Current Market Phase Assessment
**Distribution vs Accumulation**:
- **Recent Action**: Distribution characteristics after new highs
- **Volume Pattern**: High volume on decline (supply)
- **Price Action**: Sharp reversal from resistance
- **Professional Activity**: Profit-taking by smart money
### Wyckoff Schematic (Daily)
**Distribution Phase Analysis**:
- **Preliminary Supply (PS)**: Weakness at $124,597 highs
- **Buying Climax (BC)**: Failed attempt to sustain new highs
- **Automatic Reaction (AR)**: Sharp decline to $113,500
- **Secondary Test (ST)**: Current bounce to $117,500-$119,800
- **Sign of Weakness (SOW)**: Expected if fails to reclaim $121,000
**Alternative Accumulation Scenario**:
- **Spring Action**: Test below $113,500 with quick recovery
- **Last Point of Support (LPS)**: $114,000-$116,000 area
- **Sign of Strength (SOS)**: Break above $122,000 with volume
### Wyckoff Point & Figure Count
**Horizontal Count**: From $113,500 to $124,597 range
- **Count**: 11,097 points
- **Projection Up**: $135,694 (124,597 + 11,097)
- **Projection Down**: $102,403 (113,500 - 11,097)
### Volume Analysis (Wyckoff Context)
**Recent Volume Characteristics**:
- **High Volume Decline**: Professional distribution
- **Low Volume Bounce**: Lack of demand (bearish)
- **Volume Divergence**: Lower volume on recent highs
- **Institutional Flow**: Net selling pressure evident
### Wyckoff Trading Strategy
**Distribution Scenario** (60% probability):
- **Short Setup**: Below $116,000 with volume
- **Target**: $105,000-$110,000 (cause/effect)
- **Stop**: Above $121,000
**Accumulation Scenario** (40% probability):
- **Long Setup**: Above $122,000 with expanding volume
- **Target**: $135,000-$140,000
- **Stop**: Below $113,000
---
## 4. W.D. GANN THEORY ANALYSIS
### Square of 9 Analysis
**Current Position**: $117,498 (Square root ≈ 342.8)
**Natural Resistance Levels**:
- **345°**: $119,025 (immediate resistance)
- **360°/0°**: $129,600 (major resistance)
- **15°**: $131,769 (significant resistance)
- **30°**: $135,000 (major Gann resistance)
- **45°**: $139,365 (strong resistance)
**Natural Support Levels**:
- **330°**: $108,900 (significant support)
- **315°**: $99,225 (major support)
- **300°**: $90,000 (critical support)
- **270°**: $72,900 (extreme support)
### Gann Angles Analysis
**Primary Angle Lines** (from $15,500 2020 low):
- **1x1 Angle** (45°): $85,000 (major rising support)
- **2x1 Angle** (63.75°): $105,000 (steep support)
- **1x2 Angle** (26.25°): $65,000 (gentle support)
- **1x4 Angle** (14.04°): $45,000 (long-term support)
**Secondary Angles** (from $69,000 2021 high):
- **1x1 Declining**: $95,000 (resistance turned support)
- **2x1 Declining**: $110,000 (current support area)
### Gann Time Theory
**Active Cycles** (August-December 2025):
- **30-Day Cycle**: Major turn August 25-30, 2025
- **60-Day Cycle**: Significant reversal October 1-5, 2025
- **90-Day Cycle**: Important turn November 15-20, 2025
- **180-Day Cycle**: Major cycle peak February 2026
**Historical Analysis**:
- **Previous 90-day high**: May 15, 2025
- **Next projected turn**: November 15, 2025
- **Annual cycle**: December typically strong for Bitcoin
### Square of Price and Time
**Price-Time Equality** (from $49,000 low):
- **123 days elapsed**: 123 × $500 = $61,500 move = $110,500 target
- **180 days projection**: 180 × $500 = $90,000 move = $139,000 target
### Gann Master Charts
**Price Forecasting** (September-December 2025):
- **Conservative**: $125,000-$130,000 (based on 1x1 angles)
- **Moderate**: $135,000-$145,000 (Square of 9 resistance)
- **Aggressive**: $155,000-$165,000 (major Gann projections)
**Time Forecasting**:
- **Immediate Turn**: August 28-30 (30-day cycle)
- **Intermediate High**: October 15-20 (60-day cycle)
- **Major Peak**: December 15-25 (annual pattern)
### Ranges in Harmony
**Current Range**: $49,000 to $124,597 ($75,597 range)
- **1/8 Range**: $58,449 (major support)
- **2/8 Range**: $68,199 (significant support)
- **3/8 Range**: $77,948 (moderate support)
- **4/8 Range**: $86,798 (midpoint - critical)
- **5/8 Range**: $96,648 (resistance turned support)
- **6/8 Range**: $106,498 (key current support)
- **7/8 Range**: $116,347 (current price area)
---
## 5. ICHIMOKU KINKO HYO ANALYSIS
### Ichimoku Components (Daily Chart)
**Tenkan-sen** (9-period): $118,450
- **Current Relation**: Price slightly below Tenkan
- **Trend**: Flattening after sharp rise
- **Signal**: Dynamic resistance on bounces
**Kijun-sen** (26-period): $115,200
- **Current Relation**: Price above Kijun (bullish bias)
- **Trend**: Rising but decelerating
- **Key Level**: Critical support for trend continuation
**Senkou Span A** (Leading Span A): $120,500
**Senkou Span B** (Leading Span B): $108,900
- **Cloud Status**: Bullish cloud (Span A > Span B)
- **Cloud Thickness**: Strong support (11,600 points)
- **Price vs Cloud**: Above cloud (bullish long-term)
**Chikou Span** (Lagging Span): $117,498
- **26 periods ago**: $89,500
- **Momentum**: Strongly positive
- **Trend Confirmation**: Supports bullish bias
### Ichimoku Signal Analysis
**TK Cross** (Tenkan-Kijun Crossover):
- **Current Status**: Tenkan above Kijun (bullish)
- **Signal Strength**: Weakening (gap narrowing)
- **Risk**: Bearish cross if Tenkan falls below Kijun
**Kumo Breakout**:
- **Current Position**: Price above cloud (bullish)
- **Support Zone**: $108,900-$120,500 (cloud area)
- **Risk Level**: Break below $108,900 (cloud bottom)
**Chikou Span Analysis**:
- **Clear Space**: Path relatively clear
- **Resistance**: Minor resistance at $125,000 area
- **Support**: Strong momentum reading
### Multi-Timeframe Ichimoku
**4-Hour Ichimoku**:
- **Tenkan-sen**: $117,800
- **Kijun-sen**: $116,200
- **Cloud**: Bearish (red cloud)
- **Price**: Below cloud (bearish short-term)
**1-Hour Ichimoku**:
- **Trend**: Neutral to bearish
- **Cloud**: Thin bearish cloud
- **Signal**: Waiting for direction
### Ichimoku Strategy
**Bullish Scenario**:
- **Entry**: Above $120,500 (cloud top)
- **Target**: $125,000-$130,000
- **Stop**: $115,000 (below Kijun-sen)
**Bearish Scenario**:
- **Entry**: Below $115,000 (Kijun-sen break)
- **Target**: $108,900 (cloud bottom)
- **Stop**: $120,500 (above cloud)
---
## 6. JAPANESE CANDLESTICK ANALYSIS
### Recent Major Patterns (Daily Chart)
**Bearish Engulfing Pattern** (August 12-13, 2025):
- **Formation**: Large red candle engulfing previous green
- **Location**: At all-time high resistance ($124,597)
- **Volume**: Extremely high (distribution)
- **Implication**: Strong reversal signal
- **Target**: $110,000-$115,000
**Evening Star Formation** (August 11-13, 2025):
- **First Candle**: Strong bullish to new highs
- **Second Candle**: Small-bodied doji/spinning top
- **Third Candle**: Strong bearish engulfing
- **Confirmation**: Complete reversal pattern
- **Reliability**: Very high (at major resistance)
### Multi-Timeframe Candlestick Analysis
**Weekly Chart**:
- **Pattern**: Shooting star formation
- **Upper Shadow**: Long rejection of highs
- **Body**: Small relative to shadow
- **Volume**: Above average
- **Implication**: Weekly reversal signal
**4-Hour Chart**:
- **Recent Pattern**: Three black crows
- **Formation**: Three consecutive red candles
- **Each Closing**: Lower than previous
- **Volume**: Increasing on each decline
- **Target**: Continuation lower
**1-Hour Chart**:
- **Current Pattern**: Hammer formation potential
- **Location**: Near $117,000 support
- **Lower Shadow**: Testing support with rejection
- **Confirmation**: Needed with bullish follow-through
### Advanced Candlestick Combinations
**Dark Cloud Cover**:
- **Formation**: Bearish reversal at highs
- **Penetration**: Over 50% of previous candle
- **Volume**: Higher than average
- **Target**: $112,000-$115,000
**Three Outside Down**:
- **Day 1**: Small bullish candle
- **Day 2**: Bearish engulfing
- **Day 3**: Continuation lower
- **Status**: Pattern complete
- **Implication**: Strong bearish signal
### Candlestick-Based Targets
**Pattern Projections**:
- **Evening Star**: $108,000-$113,000
- **Bearish Engulfing**: $110,000-$116,000
- **Shooting Star**: $105,000-$112,000
- **Three Black Crows**: $112,000-$118,000
---
## 7. RSI ANALYSIS (Multi-Timeframe)
### Daily RSI Analysis
**Current Reading**: 52.8
- **Condition**: Neutral territory
- **Trend**: Declining from overbought levels (85+)
- **Divergence**: Potential bearish divergence forming
- **Support**: 50 level critical for bullish bias
- **Resistance**: 60 level for bullish confirmation
**RSI Pattern Analysis**:
- **Peak**: 87.2 at recent highs (extreme overbought)
- **Current Decline**: Healthy cooling off
- **Target**: 40-45 zone (oversold bounce area)
- **Trend**: Still in bullish structure above 50
### 4-Hour RSI Analysis
**Current Reading**: 45.2
- **Condition**: Approaching oversold
- **Momentum**: Declining momentum slowing
- **Pattern**: Potential double bottom forming
- **Support**: 40 level key bounce zone
### 1-Hour RSI Analysis
**Current Reading**: 48.7
- **Condition**: Neutral with downward bias
- **Trend**: Sideways consolidation
- **Levels**: 45 support, 55 resistance
- **Signal**: Waiting for direction
### Weekly RSI Analysis
**Current Reading**: 68.5
- **Condition**: Strong but cooling from overbought
- **Trend**: Still in strong bullish territory
- **Historical**: Room for further upside long-term
- **Support**: 60 level major support
### RSI Divergence Analysis
**Bearish Divergences**:
- **Daily**: Higher price, lower RSI peaks
- **4-Hour**: Confirmed bearish divergence
- **Implication**: Correction expected
**Target RSI Levels**:
- **Oversold Bounce**: RSI 35-40 (price $105,000-$110,000)
- **Neutral Reset**: RSI 45-55 (price $112,000-$118,000)
- **Bullish Resumption**: RSI >60 (price >$125,000)
---
## 8. BOLLINGER BANDS ANALYSIS
### Daily Bollinger Bands
**Current Configuration**:
- **Upper Band**: $127,500 (2 std dev)
- **Middle Band (SMA20)**: $115,800
- **Lower Band**: $104,100 (2 std dev)
- **Band Width**: Extremely wide (high volatility)
**Price Action**:
- **Current Position**: Between middle and upper band
- **Recent**: Rejected from upper band (resistance)
- **Trend**: Moving toward middle band
- **Target**: Lower band test possible ($104,100)
### Bollinger Band Signals
**Band Rejection**:
- **Upper Band Touch**: Strong resistance at $127,500
- **Volume**: High volume rejection (bearish)
- **Pattern**: Classic sell signal from upper band
- **Target**: Middle band ($115,800) then lower band
**Squeeze Analysis**:
- **Current Status**: Bands expanding (high volatility)
- **Previous**: Squeeze before breakout to highs
- **Next Phase**: Continued expansion expected
- **Direction**: Bias toward lower band
### 4-Hour Bollinger Bands
**Configuration**:
- **Upper Band**: $122,500
- **Middle Band**: $117,200
- **Lower Band**: $111,900
- **Position**: Near middle band (neutral)
### 1-Hour Bollinger Bands
**Configuration**:
- **Upper Band**: $119,500
- **Middle Band**: $117,000
- **Lower Band**: $114,500
- **Trend**: Consolidating within bands
### Bollinger Strategy
**Sell Setup**:
- **Trigger**: Break below middle band ($115,800)
- **Target**: Lower band ($104,100)
- **Stop**: Above upper band ($127,500)
**Buy Setup**:
- **Trigger**: Bounce from lower band with RSI oversold
- **Target**: Return to middle then upper band
- **Stop**: Sustained break below lower band
---
## 9. VWAP ANALYSIS
### Daily VWAP
**Current VWAP**: $118,650
- **Price vs VWAP**: Below VWAP (bearish)
- **Distance**: $1,152 below (significant)
- **Trend**: VWAP declining (distribution)
- **Reclaim Level**: Above $118,650 bullish
### VWAP Deviation Bands
**Standard Deviations**:
- **+3σ**: $135,200 (extreme resistance)
- **+2σ**: $128,900 (strong resistance)
- **+1σ**: $123,800 (moderate resistance)
- **VWAP**: $118,650 (pivot)
- **-1σ**: $113,500 (moderate support)
- **-2σ**: $108,350 (strong support)
- **-3σ**: $103,200 (extreme support)
**Current Position**: Between VWAP and -1σ (slight bearish bias)
### Weekly VWAP
**Level**: $92,500
- **Price vs VWAP**: Significantly above (bullish long-term)
- **Trend**: Rising strongly
- **Support**: Major support level
### Monthly VWAP
**Level**: $78,200
- **Distance**: $39,298 above (extremely bullish)
- **Trend**: Steep upward trajectory
- **Significance**: Long-term bull market confirmation
### VWAP Trading Strategy
**Mean Reversion**:
- **Current**: Price below daily VWAP
- **Entry**: Near -1σ ($113,500) with RSI oversold
- **Target**: Return to VWAP ($118,650)
- **Extended**: +1σ ($123,800)
**Breakout Strategy**:
- **Bullish**: Sustained reclaim of VWAP
- **Target**: Upper deviation bands
- **Bearish**: Break below -1σ with volume
- **Target**: -2σ ($108,350)
---
## 10. MOVING AVERAGES ANALYSIS
### Simple Moving Averages (Daily)
**Current Alignment**:
- **20 SMA**: $115,800 (declining)
- **50 SMA**: $108,500 (rising)
- **100 SMA**: $95,200 (rising strongly)
- **200 SMA**: $78,500 (rising strongly)
**Market Structure**:
- **Short-term**: Bearish (20 SMA declining)
- **Medium-term**: Bullish (50/100 SMA rising)
- **Long-term**: Strongly bullish (200 SMA steep rise)
### Exponential Moving Averages (Daily)
**EMA Configuration**:
- **12 EMA**: $116,800 (immediate resistance)
- **26 EMA**: $113,200 (key support)
- **50 EMA**: $107,500 (major support)
- **100 EMA**: $92,800 (long-term support)
### Moving Average Convergence/Divergence (MACD)
**Daily MACD**:
- **MACD Line**: 2,450 (declining from peaks)
- **Signal Line**: 3,120 (bearish crossover)
- **Histogram**: -670 (negative momentum)
- **Trend**: Bearish momentum building
### MA Support/Resistance Levels
**Resistance Cluster**: $115,800-$116,800
- **20 SMA & 12 EMA**: Major resistance zone
- **Significance**: Key level for trend continuation
**Support Cluster**: $107,500-$108,500
- **50 SMA & 50 EMA**: Important support
- **Break Below**: Would signal deeper correction
### Golden/Death Cross Analysis
**Current Status**:
- **50/200 SMA**: Golden Cross active (bullish)
- **20/50 SMA**: Death Cross developing (bearish short-term)
**Implications**:
- **Long-term**: Bull market intact
- **Short-term**: Corrective phase expected
---
## 11. MULTI-TIMEFRAME ANALYSIS
### 5-Minute Chart Analysis
**Trend**: Choppy, range-bound
**Range**: $116,500-$118,500
**Support**: $116,800 (recent lows)
**Resistance**: $118,200 (intraday highs)
**Volume**: Below average (consolidation)
**Pattern**: Symmetrical triangle
**Breakout**: Awaiting direction (slight bearish bias)
**Target Up**: $119,500
**Target Down**: $115,500
### 15-Minute Chart Analysis
**Trend**: Sideways to slightly bearish
**Pattern**: Descending triangle
**Support**: $117,000 (horizontal)
**Resistance**: $118,500-$119,000 (declining)
**Volume**: Decreasing (coiling for move)
**RSI**: Neutral (45-55 range)
**MACD**: Slight bearish bias
**Breakout Expected**: Within 6-12 hours
**Target**: $115,000 (if breaks down)
### 30-Minute Chart Analysis
**Trend**: Corrective within larger uptrend
**Structure**: ABC correction pattern
**A Wave**: $124,597 to $113,500
**B Wave**: $113,500 to $119,800 (complete)
**C Wave**: In progress, targeting $110,000-$114,000
**Time**: 2-4 hours for completion
**Volume**: Declining on bounces (bearish)
**Next Phase**: Reversal expected after C completion
### 1-Hour Chart Analysis
**Trend**: Bearish correction
**Elliott Wave**: Wave 4 of larger degree
**Pattern**: Complex corrective (WXY)
**Support**: $114,000-$116,000 (major)
**Resistance**: $120,000-$122,000 (key level)
**Ichimoku**: Below cloud (bearish)
**RSI**: Approaching oversold (40-45)
**Target**: $112,000-$115,000 (correction completion)
**Timeline**: 1-3 days
### 4-Hour Chart Analysis
**Primary Trend**: Bullish correction within uptrend
**Wave Structure**: Intermediate Wave (4)
**Pattern**: Double zigzag (W-X-Y)
**Current Phase**: Y wave of correction
**Support Zone**: $110,000-$115,000 (critical)
**Resistance Zone**: $122,000-$125,000 (major)
**Volume Profile**: Selling pressure evident
**Harmonic Patterns**: Multiple bearish patterns active
**Completion**: Expected within 3-7 days
### Intraday Summary (5M-1H)
**Overall Bias**: Bearish for next 12-24 hours
**Key Level**: $117,000 support break would accelerate down
**Target**: $114,000-$115,500 (initial)
**Resistance**: $119,000-$120,000 (strong)
**Strategy**: Fade bounces, buy oversold at support
---
## 12. SWING TRADING ANALYSIS (4H-Monthly)
### 4-Hour Swing Perspective
**Trend**: Corrective phase in larger uptrend
**Current Phase**: Wave (4) correction
**Structure**: Complex double zigzag
**Support**: $110,000-$115,000 (major confluence)
**Resistance**: $122,000-$125,000 (key breakout level)
**Pattern**: Large bull flag or pennant
**Volume**: Distribution characteristics
**Timeline**: 1-2 weeks for completion
**Target**: $135,000-$145,000 (after correction)
### Daily Swing Analysis
**Major Trend**: Secular bull market continuation
**Current Wave**: Primary degree Wave (4)
**Correction Type**: Time and price correction
**Expected Depth**: 15-25% ($105,000-$115,000)
**Duration**: 3-6 weeks total
**Support Confluence**: $108,000-$115,000
**Resistance**: $125,000-$130,000 (reclaim needed)
**Next Phase**: Final Wave (5) to new highs
**Ultimate Target**: $150,000-$200,000 (2026)
### Weekly Swing Analysis
**Super Trend**: Multi-year bull market
**Current Cycle**: Wave III of larger degree
**Phase**: Late-stage correction before final push
**Major Support**: $85,000-$105,000 (weekly demand)
**Major Resistance**: $130,000-$140,000 (weekly supply)
**Seasonal Factor**: Q4 historically strong for Bitcoin
**Institutional Flow**: Continued adoption trend
**Long-term View**: $200,000+ by 2026-2027
### Monthly Swing Analysis
**Decade Trend**: Exponential adoption curve
**Current Position**: Mid-cycle bull run
**Cycle Stage**: Institutional adoption phase
**Monthly Support**: $75,000-$90,000 (major crash protection)
**Monthly Resistance**: $150,000-$200,000 (cycle targets)
**Fundamental Backdrop**: Growing ETF adoption, corporate treasury
**Regulatory Environment**: Increasingly favorable
**Ultimate Targets**: $500,000-$1,000,000 (2030s)
### Swing Trading Strategy
**Accumulation Approach**:
- **Entry Range**: $105,000-$120,000 (scale in)
- **Core Position**: 70% in range
- **Breakout Addition**: 30% above $130,000
- **Stop Loss**: $95,000 (major trend invalidation)
- **Target Sequence**: $135,000 → $155,000 → $180,000
- **Timeline**: 6-18 months
**Risk Management**:
- **Position Size**: 5-15% of portfolio (based on risk tolerance)
- **Diversification**: Consider Bitcoin miners, crypto ETFs
- **Hedge Options**: Put options for downside protection
---
## 13. KEY LEVELS & PRICE TARGETS
### Critical Support Levels (Priority Order)
1. **$116,000-$117,500** - Immediate support (current area)
2. **$114,000-$115,500** - Minor support (harmonic targets)
3. **$110,000-$113,000** - Moderate support (Elliott Wave targets, VWAP -1σ)
4. **$105,000-$108,000** - Major support (Elliott Wave 61.8%, Bollinger lower band)
5. **$95,000-$100,000** - Critical support (previous Wave 1 high, psychological)
6. **$85,000-$90,000** - Ultimate support (Gann angles, monthly demand)
### Critical Resistance Levels (Priority Order)
1. **$119,000-$120,000** - Immediate resistance (VWAP, previous support)
2. **$122,000-$125,000** - Minor resistance (harmonic retracements, MA cluster)
3. **$127,000-$130,000** - Moderate resistance (Bollinger upper, psychological)
4. **$135,000-$140,000** - Major resistance (Elliott Wave 5 targets)
5. **$150,000-$155,000** - Strong resistance (extended Elliott targets)
6. **$180,000-$200,000** - Ultimate resistance (super cycle projections)
### Short-term Targets (Next 1-4 weeks)
**Bearish Scenario** (65% probability):
- **Initial**: $114,000-$116,000 (correction continuation)
- **Extended**: $108,000-$112,000 (deeper correction)
- **Extreme**: $105,000-$108,000 (maximum correction)
**Bullish Scenario** (35% probability):
- **Breakout**: Above $122,000 (correction failure)
- **Target**: $130,000-$135,000 (resumption higher)
- **Extended**: $140,000-$145,000 (accelerated move)
### Medium-term Targets (Next 1-6 months)
**After Correction Completion**:
- **Wave 5 Minimum**: $135,000-$145,000
- **Wave 5 Extended**: $155,000-$165,000
- **Wave 5 Extreme**: $180,000-$200,000
- **Timeline**: December 2025 - March 2026
### Long-term Targets (6-24 months)
**Super Cycle Completion**:
- **Conservative**: $200,000-$250,000
- **Moderate**: $300,000-$400,000
- **Aggressive**: $500,000-$750,000
- **Timeline**: 2026-2027
---
## 14. VOLUME ANALYSIS & MARKET STRUCTURE
### Volume Profile Analysis
**High Volume Nodes (Value Areas)**:
- **Primary Node**: $85,000-$95,000 (28% of volume - major support)
- **Secondary Node**: $105,000-$115,000 (22% of volume - current battle zone)
- **Tertiary Node**: $65,000-$75,000 (18% of volume - deep support)
**Point of Control (POC)**: $89,500 (highest volume level)
**Value Area High (VAH)**: $118,000 (fair value upper bound)
**Value Area Low (VAL)**: $72,000 (fair value lower bound)
### Volume Trend Analysis
**Recent Volume Characteristics**:
- **New High Volume**: Extremely high at $124,597 (climactic)
- **Decline Volume**: Above average (selling pressure)
- **Bounce Volume**: Below average (weak demand)
- **Current Trend**: Declining volume on bounces (bearish)
### On-Balance Volume (OBV)
**Trend Analysis**:
- **Recent Peak**: At all-time highs (confirming price)
- **Current Action**: Declining with price
- **Divergence**: No major divergence yet
- **Next Signal**: Break below June OBV levels would be bearish
### Volume Oscillators
**Chaikin Money Flow (CMF)**:
- **Current Reading**: -0.25 (distribution)
- **Trend**: Declining from positive territory
- **Signal**: Below -0.20 confirms selling pressure
**Volume Rate of Change (VROC)**:
- **Current**: +75% (well above average)
- **Pattern**: High volume associated with decline
- **Implication**: Professional distribution occurring
### Accumulation/Distribution Line
**Current Trend**: Declining (distribution phase)
**Recent Action**: Sharp decline from highs
**Divergence**: Confirming price action
**Signal**: Recovery above recent highs needed for bullish confirmation
---
## 15. MARKET SENTIMENT & INTERMARKET ANALYSIS
### Bitcoin Sentiment Indicators
**Fear & Greed Index**: 25 (Fear territory)
- **Recent Change**: From Extreme Greed (85) to Fear
- **Historical Pattern**: Fear levels often mark good buying opportunities
- **Contrarian Signal**: Current fear suggests potential bottom formation
### Institutional Activity
**ETF Flows**:
- **Recent Trend**: Net outflows during correction
- **Major Players**: BlackRock, Fidelity showing mixed flows
- **Institutional Sentiment**: Cautious after rapid gains
**Corporate Treasury Activity**:
- **MicroStrategy**: Continues accumulation strategy
- **Other Corporates**: Reduced activity at current levels
- **Sovereign Wealth**: Exploratory positions being built
### Correlation Analysis
**Traditional Markets**:
- **S&P 500 Correlation**: 0.45 (moderate positive)
- **Gold Correlation**: -0.15 (slight negative)
- **DXY Correlation**: -0.65 (strong negative)
- **10-Year Treasury**: -0.35 (moderate negative)
**Crypto Market**:
- **Ethereum Correlation**: 0.88 (very strong)
- **Altcoin Correlation**: 0.75 (strong)
- **Market Dominance**: 52.5% (stable)
### Macroeconomic Environment
**Federal Reserve Policy**:
- **Current Stance**: Accommodative
- **Rate Environment**: Supportive for risk assets
- **Forward Guidance**: Stable policy expected
**Global Liquidity**:
- **USD Liquidity**: Ample
- **Cross-border Flows**: Improving
- **Risk Appetite**: Recovering from recent caution
---
## 16. DERIVATIVES & OPTIONS ANALYSIS
### Futures Market Structure
**Contango/Backwardation**:
- **Current Structure**: Slight contango (normal)
- **3-Month Basis**: +2.1% annualized
- **6-Month Basis**: +4.8% annualized
- **Trend**: Normalizing from extreme levels
### Options Market
**Put/Call Ratio**: 1.45 (elevated fear)
**Implied Volatility**: 68% (high but declining from 85%)
**Volatility Term Structure**: Steep (near-term elevated)
**Key Option Strikes**:
- **$120,000 Calls**: Heavy resistance
- **$110,000 Puts**: Major support
- **$100,000 Puts**: Psychological support
### Perpetual Swaps
**Funding Rates**: -0.02% (slightly negative)
**Open Interest**: Declining (position unwinding)
**Long/Short Ratio**: 55/45 (slight bullish bias)
---
## 17. RISK ASSESSMENT & SCENARIOS
### Primary Scenario - Continued Correction (65% Probability)
**Process**: Elliott Wave (4) completion
**Timeline**: 2-4 weeks additional correction
**Target Zone**: $108,000-$115,000
**Catalyst**: Technical correction, profit-taking
**Risk Factors**: Deeper than expected correction
**Trading Strategy**:
- **Wait for oversold levels**: RSI <40, price <$112,000
- **Scale in gradually**: 25% positions every $3,000 decline
- **Stop loss**: Below $95,000 (trend invalidation)
### Secondary Scenario - Correction Failure (25% Probability)
**Process**: V-bottom reversal from current levels
**Catalyst**: Strong institutional buying, ETF inflows
**Timeline**: 1-2 weeks to new highs
**Target**: $130,000-$140,000 initially
**Risk**: False breakout leading to deeper correction
**Trading Strategy**:
- **Breakout Entry**: Above $122,000 with volume
- **Stop Loss**: $115,000
- **Target**: $135,000 initial
### Bear Scenario - Major Correction (10% Probability)
**Process**: Larger degree Wave 4 correction
**Catalyst**: Regulatory concerns, macro shock
**Timeline**: 2-6 months
**Target Zone**: $85,000-$95,000
**Probability**: Low due to strong adoption trends
**Risk Management**:
- **Hard Stop**: $95,000 (major trend break)
- **Position Sizing**: Reduce exposure significantly
- **Hedging**: Consider put options
---
## 18. TRADING STRATEGIES & EXECUTION
### Scalping Strategy (5M-15M timeframes)
**Market Hours**: Focus on high liquidity periods
**Range Trading**:
- **Buy**: $116,500-$117,000 (support bounces)
- **Sell**: $118,500-$119,000 (resistance)
- **Stop**: $300-500 outside range
- **Target**: $800-1,200 profit per trade
**Breakout Scalping**:
- **Long Setup**: Break above $119,000 with volume
- **Short Setup**: Break below $116,000 with volume
- **Risk/Reward**: 1:2 minimum ratio
### Day Trading Strategy (15M-1H timeframes)
**Trend Following Setup**:
- **Entry**: Direction of 1H trend with RSI confirmation
- **Stop**: Beyond recent swing high/low
- **Target**: Next significant resistance/support
- **Position Size**: 1-2% risk per trade
**Mean Reversion Setup**:
- **Entry**: Extreme RSI levels (>70 or <30)
- **Direction**: Counter-trend back to mean
- **Stop**: New extreme in same direction
- **Target**: VWAP or key moving average
### Swing Trading Strategy (4H-Daily timeframes)
**Correction Completion Setup**:
- **Entry Zone**: $108,000-$115,000 (scale in)
- **Confirmation**: RSI oversold + bullish divergence
- **Stop Loss**: $95,000 (major support break)
- **Target 1**: $125,000 (25% position)
- **Target 2**: $140,000 (50% position)
- **Target 3**: $160,000 (25% position)
- **Timeline**: 3-12 months
**Position Management**:
- **Initial Risk**: 3-5% of portfolio
- **Add on weakness**: Up to 10% total allocation
- **Trail stops**: Below major swing lows
- **Profit taking**: At resistance confluences
### Long-term Investment Strategy (Weekly-Monthly)
**Dollar Cost Averaging**:
- **Allocation**: 5-20% of investment portfolio
- **Frequency**: Weekly or monthly purchases
- **Range**: Accumulate heavily below $120,000
- **Reduce**: Above $150,000
- **Target**: 5-10 year hold period
**Strategic Accumulation**:
- **Phase 1**: Current correction ($105,000-$120,000)
- **Phase 2**: Major correction if occurs ($85,000-$105,000)
- **Hold Through**: All intermediate volatility
- **Exit Strategy**: Partial above $200,000
---
## 19. ADVANCED PATTERN RECOGNITION
### Fractal Analysis
**Current Fractal Structure**:
- **Major Fractal**: 2020-2025 bull market cycle
- **Intermediate Fractal**: March 2024 - Present wave structure
- **Minor Fractal**: August 2025 correction pattern
- **Micro Fractal**: Daily price action patterns
**Fractal Projections**:
- **Self-similarity**: Current correction mirrors March 2024 structure
- **Time Ratios**: 0.618 and 1.618 Fibonacci relationships
- **Price Ratios**: Similar percentage corrections expected
### Market Geometry
**Sacred Geometry Levels**:
- **Golden Ratio Points**: $108,697 (61.8% correction)
- **Phi Projections**: $138,449 (1.618 extension)
- **Square Root Relationships**: Key support/resistance
### Cycle Harmonics
**Price Cycle Analysis**:
- **210-Day Cycle**: Major intermediate cycle
- **89-Day Cycle**: Current correction cycle
- **34-Day Cycle**: Short-term turning points
- **Confluence**: Multiple cycles bottoming late August
---
## 20. FINAL SYNTHESIS & RECOMMENDATIONS
### Technical Confluence Assessment
**Overall Score**: 7.1/10 (Moderately Bearish Near-term, Bullish Long-term)
**Bearish Factors** (Near-term):
- Elliott Wave (4) correction in progress
- Multiple harmonic patterns targeting lower levels
- Wyckoff distribution characteristics
- Candlestick reversal patterns at highs
- RSI and momentum indicators declining
**Bullish Factors** (Medium/Long-term):
- Secular bull market structure intact
- Strong volume support at lower levels
- Institutional adoption continuing
- Favorable macro environment
- Historical cycle patterns supportive
### Primary Trading Recommendation
**Strategy**: Patience for better entry opportunities
**Current Assessment**: Wait for correction completion
**Preferred Entry**: $108,000-$115,000 (scale in approach)
**Risk Management**: Hard stop below $95,000 (major trend invalidation)
**Target Sequence**: $125,000 → $140,000 → $165,000 → $200,000+
**Timeline**: 6-18 months for major targets
### Tactical Approach by Timeframe
**Intraday (Next 1-7 days)**:
- **Bias**: Bearish to neutral
- **Strategy**: Fade bounces, wait for oversold
- **Key Levels**: $117,000 support, $120,000 resistance
- **Risk**: High volatility expected
**Swing (Next 2-8 weeks)**:
- **Bias**: Bearish then bullish
- **Strategy**: Accumulate on weakness below $115,000
- **Target**: Correction completion then reversal
- **Risk**: 15-25% downside possible
**Position (Next 3-12 months)**:
- **Bias**: Strongly bullish
- **Strategy**: Build core positions on any weakness
- **Target**: New all-time highs $150,000-$200,000
- **Risk**: Major trend change below $85,000
### Portfolio Allocation Recommendations
**Conservative Investors**:
- **Current Allocation**: 2-5% (wait for lower levels)
- **Target Allocation**: 5-10% (on correction completion)
- **Strategy**: DCA approach, ETF exposure preferred
**Moderate Risk Investors**:
- **Current Allocation**: 5-10% (begin scaling)
- **Target Allocation**: 10-15% (full position on weakness)
- **Strategy**: Swing trading with core position
**Aggressive Traders**:
- **Current Allocation**: 10-15% (active trading)
- **Target Allocation**: 15-25% (leveraged strategies possible)
- **Strategy**: Full spectrum trading across timeframes
### Risk Management Framework
**Position Sizing**:
- **Maximum Risk**: 20% portfolio (aggressive)
- **Moderate Risk**: 10-15% portfolio
- **Conservative**: 5% portfolio maximum
**Stop Loss Strategy**:
- **Tight Stops**: Day trading (2-5%)
- **Swing Stops**: Major support breaks (10-15%)
- **Position Stops**: Trend invalidation (20-25%)
**Profit Taking**:
- **Scale out**: At major resistance levels
- **Trail stops**: Below significant support levels
- **Long-term holds**: Multi-year perspective
---
## CONCLUSION
Bitcoin stands at a critical juncture following the recent all-time highs above $124,500. The comprehensive technical analysis across multiple methodologies strongly suggests a corrective phase is underway, presenting both challenges and opportunities for different trading approaches.
**Key Findings**:
1. **Elliott Wave analysis** indicates Wave (4) correction targeting $108,000-$115,000
2. **Harmonic patterns** confirm potential deeper pullback before resumption
3. **Wyckoff method** shows distribution characteristics but within larger accumulation
4. **Gann analysis** supports both correction targets and longer-term bullish projections
5. **Traditional indicators** confirm corrective phase with oversold bounce opportunities
**Strategic Outlook**:
The analysis strongly favors patience in the near-term, allowing the current correction to complete before establishing significant long positions. The secular bull market remains intact, and any weakness below $115,000 should be viewed as an accumulation opportunity for the next major leg higher toward $150,000-$200,000+ targets.
**Final Recommendation**:
Maintain a constructively bullish medium-term outlook while respecting the current corrective phase. Use any weakness below $115,000 as an opportunity to build positions for the anticipated final wave higher in this major cycle, expected to begin in Q4 2025 or Q1 2026.
For those interested in further developing their trading skills based on these types of analyses, consider exploring the mentoring program offered by Shunya dot Trade.(world wide web shunya dot trade)
I welcome your feedback on this analysis, as it will inform and enhance my future work.
Regards,
Shunya.Trade
world wide web shunya dot trade
⚠️ Disclaimer: This post is educational content and does not constitute investment advice, financial advice, or trading recommendations. The views expressed here are based on technical analysis and are shared solely for informational purposes. The stock market is subject to risks, including capital loss, and readers should exercise due diligence before investing. We do not take responsibility for decisions made based on this content. Consult a certified financial advisor for personalized guidance.
**Asset**: Bitcoin / US Dollar (BTCUSD)
**Reference Price**: $117,498.30 (August 16th, 2025)
**Analysis Date**: August 17, 2025
**Market Cap**: ~$2.3 Trillion (estimated)
## EXECUTIVE SUMMARY
Bitcoin is experiencing a critical technical juncture following a sharp reversal from recent all-time highs above $124,500. The current price action suggests a complex corrective phase within a larger bullish structure. Multiple analytical methodologies indicate potential for both short-term volatility and longer-term continuation of the secular bull market.
---
## 1. ELLIOTT WAVE ANALYSIS
### Super Cycle Perspective (Monthly/Yearly)
**Major Degree Classification**:
- **Super Cycle**: Wave (III) in progress since 2020 lows
- **Cycle Degree**: Wave III of (III) - the heart of the bull market
- **Primary Degree**: Wave (5) of III nearing completion
- **Current Position**: Complex corrective phase after new highs
### Primary Wave Structure (Weekly/Daily)
**Wave Count Analysis**:
- **Wave (1)**: Completed at $73,800 (March 2024)
- **Wave (2)**: Corrective decline to $49,000 (August 2024)
- **Wave (3)**: Extended impulse to $124,597 (August 2025)
- **Wave (4)**: Current corrective phase in progress
- **Wave (5)**: Projected final push higher
### Current Corrective Structure (Daily/4H)
**Wave (4) Analysis**:
- **Pattern Type**: Complex corrective structure (Double Zigzag W-X-Y)
- **W Wave**: Sharp decline from $124,597 to $113,500
- **X Wave**: Corrective bounce to $119,800 (completed)
- **Y Wave**: Currently unfolding, targeting $110,000-$114,000
**Internal Structure**:
- **Subwave a**: Completed at $113,500
- **Subwave b**: Bounce to $119,800 (current level vicinity)
- **Subwave c**: Expected decline to complete Wave (4)
### Elliott Wave Projections
**Wave (4) Completion Targets**:
- **Shallow Correction**: $114,000-$116,000 (38.2% retracement)
- **Moderate Correction**: $110,000-$113,000 (50% retracement)
- **Deep Correction**: $105,000-$108,000 (61.8% retracement)
**Wave (5) Targets** (after correction completion):
- **Minimum Target**: $135,000-$140,000 (equality with Wave 1)
- **Extended Target**: $155,000-$165,000 (1.618 extension)
- **Extreme Target**: $200,000-$220,000 (2.618 extension)
### Time Analysis
**Wave (4) Duration Expectations**:
- **Typical Duration**: 21-34 days (based on Wave (2) relationship)
- **Current Progress**: Day 7 of correction (started August 12)
- **Completion Window**: August 25 - September 5, 2025
**Wave (5) Timeline**:
- **Duration**: 45-89 days (Fibonacci relationship)
- **Completion**: December 2025 - February 2026
### Invalidation Levels
- **Critical Support**: $95,000 (breaks Wave (1) high)
- **Alternate Count**: Below $95,000 suggests larger degree correction
---
## 2. HARMONIC PATTERN ANALYSIS
### Active Harmonic Formations
**Bearish Deep Crab Pattern (Daily)**
- **X to A**: Reference leg from $49,000 to $124,597
- **A to B**: 0.618 retracement targeting $119,200
- **B to C**: 0.886 retracement to $121,800
- **C to D (PRZ)**: 2.24-3.618 extension targeting $110,000-$114,000
- **Current Status**: C to D leg in progress
- **Pattern Completion**: Expected within 1-2 weeks
**Target Projections** (after pattern completion):
- **T1**: $120,000 (38.2% CD retracement)
- **T2**: $125,000 (61.8% CD retracement)
- **T3**: $130,000 (78.6% CD retracement)
**Bullish Bat Pattern (4-Hour)**
- **X to A**: Swing high to swing low establishment
- **A to B**: 0.382-0.500 retracement at $118,500
- **B to C**: 0.382-0.886 retracement at $115,200
- **C to D**: 0.886 XA retracement targeting $112,500-$114,000
- **Completion Status**: Near PRZ zone
**ABCD Pattern (1-Hour)**
- **AB = CD Structure**: Equal wave decline pattern
- **A to B**: Initial decline $124,597 to $119,500
- **B to C**: Corrective bounce to $122,100
- **C to D**: 127.2-161.8% extension to $113,500-$115,000
- **Current Status**: Near completion of D point
### Gartley Pattern (Weekly)
**Long-term Bullish Gartley**:
- **X Point**: $15,500 (2020 low)
- **A Point**: $69,000 (2021 high)
- **B Point**: $15,500 (2022 low) - 0.786 retracement
- **C Point**: $124,597 (current high area)
- **D Point Projection**: $85,000-$95,000 (if pattern completes)
**Note**: This larger pattern suggests potential for deeper correction if activated
### M & W Patterns
**M-Top Formation (Daily)**:
- **Left Peak**: $124,597 (August 12, 2025)
- **Valley**: $113,500 (August 14, 2025)
- **Right Peak**: Potential retest of highs
- **Neckline**: $113,500 support area
- **Break Target**: $102,000-$105,000
**W-Bottom Potential (4-Hour)**:
- **First Low**: $113,500 (established)
- **Second Low**: $114,000-$116,000 (current formation area)
- **Neckline**: $119,800-$121,000
- **Breakout Target**: $125,000-$128,000
---
## 3. WYCKOFF METHOD ANALYSIS
### Current Market Phase Assessment
**Distribution vs Accumulation**:
- **Recent Action**: Distribution characteristics after new highs
- **Volume Pattern**: High volume on decline (supply)
- **Price Action**: Sharp reversal from resistance
- **Professional Activity**: Profit-taking by smart money
### Wyckoff Schematic (Daily)
**Distribution Phase Analysis**:
- **Preliminary Supply (PS)**: Weakness at $124,597 highs
- **Buying Climax (BC)**: Failed attempt to sustain new highs
- **Automatic Reaction (AR)**: Sharp decline to $113,500
- **Secondary Test (ST)**: Current bounce to $117,500-$119,800
- **Sign of Weakness (SOW)**: Expected if fails to reclaim $121,000
**Alternative Accumulation Scenario**:
- **Spring Action**: Test below $113,500 with quick recovery
- **Last Point of Support (LPS)**: $114,000-$116,000 area
- **Sign of Strength (SOS)**: Break above $122,000 with volume
### Wyckoff Point & Figure Count
**Horizontal Count**: From $113,500 to $124,597 range
- **Count**: 11,097 points
- **Projection Up**: $135,694 (124,597 + 11,097)
- **Projection Down**: $102,403 (113,500 - 11,097)
### Volume Analysis (Wyckoff Context)
**Recent Volume Characteristics**:
- **High Volume Decline**: Professional distribution
- **Low Volume Bounce**: Lack of demand (bearish)
- **Volume Divergence**: Lower volume on recent highs
- **Institutional Flow**: Net selling pressure evident
### Wyckoff Trading Strategy
**Distribution Scenario** (60% probability):
- **Short Setup**: Below $116,000 with volume
- **Target**: $105,000-$110,000 (cause/effect)
- **Stop**: Above $121,000
**Accumulation Scenario** (40% probability):
- **Long Setup**: Above $122,000 with expanding volume
- **Target**: $135,000-$140,000
- **Stop**: Below $113,000
---
## 4. W.D. GANN THEORY ANALYSIS
### Square of 9 Analysis
**Current Position**: $117,498 (Square root ≈ 342.8)
**Natural Resistance Levels**:
- **345°**: $119,025 (immediate resistance)
- **360°/0°**: $129,600 (major resistance)
- **15°**: $131,769 (significant resistance)
- **30°**: $135,000 (major Gann resistance)
- **45°**: $139,365 (strong resistance)
**Natural Support Levels**:
- **330°**: $108,900 (significant support)
- **315°**: $99,225 (major support)
- **300°**: $90,000 (critical support)
- **270°**: $72,900 (extreme support)
### Gann Angles Analysis
**Primary Angle Lines** (from $15,500 2020 low):
- **1x1 Angle** (45°): $85,000 (major rising support)
- **2x1 Angle** (63.75°): $105,000 (steep support)
- **1x2 Angle** (26.25°): $65,000 (gentle support)
- **1x4 Angle** (14.04°): $45,000 (long-term support)
**Secondary Angles** (from $69,000 2021 high):
- **1x1 Declining**: $95,000 (resistance turned support)
- **2x1 Declining**: $110,000 (current support area)
### Gann Time Theory
**Active Cycles** (August-December 2025):
- **30-Day Cycle**: Major turn August 25-30, 2025
- **60-Day Cycle**: Significant reversal October 1-5, 2025
- **90-Day Cycle**: Important turn November 15-20, 2025
- **180-Day Cycle**: Major cycle peak February 2026
**Historical Analysis**:
- **Previous 90-day high**: May 15, 2025
- **Next projected turn**: November 15, 2025
- **Annual cycle**: December typically strong for Bitcoin
### Square of Price and Time
**Price-Time Equality** (from $49,000 low):
- **123 days elapsed**: 123 × $500 = $61,500 move = $110,500 target
- **180 days projection**: 180 × $500 = $90,000 move = $139,000 target
### Gann Master Charts
**Price Forecasting** (September-December 2025):
- **Conservative**: $125,000-$130,000 (based on 1x1 angles)
- **Moderate**: $135,000-$145,000 (Square of 9 resistance)
- **Aggressive**: $155,000-$165,000 (major Gann projections)
**Time Forecasting**:
- **Immediate Turn**: August 28-30 (30-day cycle)
- **Intermediate High**: October 15-20 (60-day cycle)
- **Major Peak**: December 15-25 (annual pattern)
### Ranges in Harmony
**Current Range**: $49,000 to $124,597 ($75,597 range)
- **1/8 Range**: $58,449 (major support)
- **2/8 Range**: $68,199 (significant support)
- **3/8 Range**: $77,948 (moderate support)
- **4/8 Range**: $86,798 (midpoint - critical)
- **5/8 Range**: $96,648 (resistance turned support)
- **6/8 Range**: $106,498 (key current support)
- **7/8 Range**: $116,347 (current price area)
---
## 5. ICHIMOKU KINKO HYO ANALYSIS
### Ichimoku Components (Daily Chart)
**Tenkan-sen** (9-period): $118,450
- **Current Relation**: Price slightly below Tenkan
- **Trend**: Flattening after sharp rise
- **Signal**: Dynamic resistance on bounces
**Kijun-sen** (26-period): $115,200
- **Current Relation**: Price above Kijun (bullish bias)
- **Trend**: Rising but decelerating
- **Key Level**: Critical support for trend continuation
**Senkou Span A** (Leading Span A): $120,500
**Senkou Span B** (Leading Span B): $108,900
- **Cloud Status**: Bullish cloud (Span A > Span B)
- **Cloud Thickness**: Strong support (11,600 points)
- **Price vs Cloud**: Above cloud (bullish long-term)
**Chikou Span** (Lagging Span): $117,498
- **26 periods ago**: $89,500
- **Momentum**: Strongly positive
- **Trend Confirmation**: Supports bullish bias
### Ichimoku Signal Analysis
**TK Cross** (Tenkan-Kijun Crossover):
- **Current Status**: Tenkan above Kijun (bullish)
- **Signal Strength**: Weakening (gap narrowing)
- **Risk**: Bearish cross if Tenkan falls below Kijun
**Kumo Breakout**:
- **Current Position**: Price above cloud (bullish)
- **Support Zone**: $108,900-$120,500 (cloud area)
- **Risk Level**: Break below $108,900 (cloud bottom)
**Chikou Span Analysis**:
- **Clear Space**: Path relatively clear
- **Resistance**: Minor resistance at $125,000 area
- **Support**: Strong momentum reading
### Multi-Timeframe Ichimoku
**4-Hour Ichimoku**:
- **Tenkan-sen**: $117,800
- **Kijun-sen**: $116,200
- **Cloud**: Bearish (red cloud)
- **Price**: Below cloud (bearish short-term)
**1-Hour Ichimoku**:
- **Trend**: Neutral to bearish
- **Cloud**: Thin bearish cloud
- **Signal**: Waiting for direction
### Ichimoku Strategy
**Bullish Scenario**:
- **Entry**: Above $120,500 (cloud top)
- **Target**: $125,000-$130,000
- **Stop**: $115,000 (below Kijun-sen)
**Bearish Scenario**:
- **Entry**: Below $115,000 (Kijun-sen break)
- **Target**: $108,900 (cloud bottom)
- **Stop**: $120,500 (above cloud)
---
## 6. JAPANESE CANDLESTICK ANALYSIS
### Recent Major Patterns (Daily Chart)
**Bearish Engulfing Pattern** (August 12-13, 2025):
- **Formation**: Large red candle engulfing previous green
- **Location**: At all-time high resistance ($124,597)
- **Volume**: Extremely high (distribution)
- **Implication**: Strong reversal signal
- **Target**: $110,000-$115,000
**Evening Star Formation** (August 11-13, 2025):
- **First Candle**: Strong bullish to new highs
- **Second Candle**: Small-bodied doji/spinning top
- **Third Candle**: Strong bearish engulfing
- **Confirmation**: Complete reversal pattern
- **Reliability**: Very high (at major resistance)
### Multi-Timeframe Candlestick Analysis
**Weekly Chart**:
- **Pattern**: Shooting star formation
- **Upper Shadow**: Long rejection of highs
- **Body**: Small relative to shadow
- **Volume**: Above average
- **Implication**: Weekly reversal signal
**4-Hour Chart**:
- **Recent Pattern**: Three black crows
- **Formation**: Three consecutive red candles
- **Each Closing**: Lower than previous
- **Volume**: Increasing on each decline
- **Target**: Continuation lower
**1-Hour Chart**:
- **Current Pattern**: Hammer formation potential
- **Location**: Near $117,000 support
- **Lower Shadow**: Testing support with rejection
- **Confirmation**: Needed with bullish follow-through
### Advanced Candlestick Combinations
**Dark Cloud Cover**:
- **Formation**: Bearish reversal at highs
- **Penetration**: Over 50% of previous candle
- **Volume**: Higher than average
- **Target**: $112,000-$115,000
**Three Outside Down**:
- **Day 1**: Small bullish candle
- **Day 2**: Bearish engulfing
- **Day 3**: Continuation lower
- **Status**: Pattern complete
- **Implication**: Strong bearish signal
### Candlestick-Based Targets
**Pattern Projections**:
- **Evening Star**: $108,000-$113,000
- **Bearish Engulfing**: $110,000-$116,000
- **Shooting Star**: $105,000-$112,000
- **Three Black Crows**: $112,000-$118,000
---
## 7. RSI ANALYSIS (Multi-Timeframe)
### Daily RSI Analysis
**Current Reading**: 52.8
- **Condition**: Neutral territory
- **Trend**: Declining from overbought levels (85+)
- **Divergence**: Potential bearish divergence forming
- **Support**: 50 level critical for bullish bias
- **Resistance**: 60 level for bullish confirmation
**RSI Pattern Analysis**:
- **Peak**: 87.2 at recent highs (extreme overbought)
- **Current Decline**: Healthy cooling off
- **Target**: 40-45 zone (oversold bounce area)
- **Trend**: Still in bullish structure above 50
### 4-Hour RSI Analysis
**Current Reading**: 45.2
- **Condition**: Approaching oversold
- **Momentum**: Declining momentum slowing
- **Pattern**: Potential double bottom forming
- **Support**: 40 level key bounce zone
### 1-Hour RSI Analysis
**Current Reading**: 48.7
- **Condition**: Neutral with downward bias
- **Trend**: Sideways consolidation
- **Levels**: 45 support, 55 resistance
- **Signal**: Waiting for direction
### Weekly RSI Analysis
**Current Reading**: 68.5
- **Condition**: Strong but cooling from overbought
- **Trend**: Still in strong bullish territory
- **Historical**: Room for further upside long-term
- **Support**: 60 level major support
### RSI Divergence Analysis
**Bearish Divergences**:
- **Daily**: Higher price, lower RSI peaks
- **4-Hour**: Confirmed bearish divergence
- **Implication**: Correction expected
**Target RSI Levels**:
- **Oversold Bounce**: RSI 35-40 (price $105,000-$110,000)
- **Neutral Reset**: RSI 45-55 (price $112,000-$118,000)
- **Bullish Resumption**: RSI >60 (price >$125,000)
---
## 8. BOLLINGER BANDS ANALYSIS
### Daily Bollinger Bands
**Current Configuration**:
- **Upper Band**: $127,500 (2 std dev)
- **Middle Band (SMA20)**: $115,800
- **Lower Band**: $104,100 (2 std dev)
- **Band Width**: Extremely wide (high volatility)
**Price Action**:
- **Current Position**: Between middle and upper band
- **Recent**: Rejected from upper band (resistance)
- **Trend**: Moving toward middle band
- **Target**: Lower band test possible ($104,100)
### Bollinger Band Signals
**Band Rejection**:
- **Upper Band Touch**: Strong resistance at $127,500
- **Volume**: High volume rejection (bearish)
- **Pattern**: Classic sell signal from upper band
- **Target**: Middle band ($115,800) then lower band
**Squeeze Analysis**:
- **Current Status**: Bands expanding (high volatility)
- **Previous**: Squeeze before breakout to highs
- **Next Phase**: Continued expansion expected
- **Direction**: Bias toward lower band
### 4-Hour Bollinger Bands
**Configuration**:
- **Upper Band**: $122,500
- **Middle Band**: $117,200
- **Lower Band**: $111,900
- **Position**: Near middle band (neutral)
### 1-Hour Bollinger Bands
**Configuration**:
- **Upper Band**: $119,500
- **Middle Band**: $117,000
- **Lower Band**: $114,500
- **Trend**: Consolidating within bands
### Bollinger Strategy
**Sell Setup**:
- **Trigger**: Break below middle band ($115,800)
- **Target**: Lower band ($104,100)
- **Stop**: Above upper band ($127,500)
**Buy Setup**:
- **Trigger**: Bounce from lower band with RSI oversold
- **Target**: Return to middle then upper band
- **Stop**: Sustained break below lower band
---
## 9. VWAP ANALYSIS
### Daily VWAP
**Current VWAP**: $118,650
- **Price vs VWAP**: Below VWAP (bearish)
- **Distance**: $1,152 below (significant)
- **Trend**: VWAP declining (distribution)
- **Reclaim Level**: Above $118,650 bullish
### VWAP Deviation Bands
**Standard Deviations**:
- **+3σ**: $135,200 (extreme resistance)
- **+2σ**: $128,900 (strong resistance)
- **+1σ**: $123,800 (moderate resistance)
- **VWAP**: $118,650 (pivot)
- **-1σ**: $113,500 (moderate support)
- **-2σ**: $108,350 (strong support)
- **-3σ**: $103,200 (extreme support)
**Current Position**: Between VWAP and -1σ (slight bearish bias)
### Weekly VWAP
**Level**: $92,500
- **Price vs VWAP**: Significantly above (bullish long-term)
- **Trend**: Rising strongly
- **Support**: Major support level
### Monthly VWAP
**Level**: $78,200
- **Distance**: $39,298 above (extremely bullish)
- **Trend**: Steep upward trajectory
- **Significance**: Long-term bull market confirmation
### VWAP Trading Strategy
**Mean Reversion**:
- **Current**: Price below daily VWAP
- **Entry**: Near -1σ ($113,500) with RSI oversold
- **Target**: Return to VWAP ($118,650)
- **Extended**: +1σ ($123,800)
**Breakout Strategy**:
- **Bullish**: Sustained reclaim of VWAP
- **Target**: Upper deviation bands
- **Bearish**: Break below -1σ with volume
- **Target**: -2σ ($108,350)
---
## 10. MOVING AVERAGES ANALYSIS
### Simple Moving Averages (Daily)
**Current Alignment**:
- **20 SMA**: $115,800 (declining)
- **50 SMA**: $108,500 (rising)
- **100 SMA**: $95,200 (rising strongly)
- **200 SMA**: $78,500 (rising strongly)
**Market Structure**:
- **Short-term**: Bearish (20 SMA declining)
- **Medium-term**: Bullish (50/100 SMA rising)
- **Long-term**: Strongly bullish (200 SMA steep rise)
### Exponential Moving Averages (Daily)
**EMA Configuration**:
- **12 EMA**: $116,800 (immediate resistance)
- **26 EMA**: $113,200 (key support)
- **50 EMA**: $107,500 (major support)
- **100 EMA**: $92,800 (long-term support)
### Moving Average Convergence/Divergence (MACD)
**Daily MACD**:
- **MACD Line**: 2,450 (declining from peaks)
- **Signal Line**: 3,120 (bearish crossover)
- **Histogram**: -670 (negative momentum)
- **Trend**: Bearish momentum building
### MA Support/Resistance Levels
**Resistance Cluster**: $115,800-$116,800
- **20 SMA & 12 EMA**: Major resistance zone
- **Significance**: Key level for trend continuation
**Support Cluster**: $107,500-$108,500
- **50 SMA & 50 EMA**: Important support
- **Break Below**: Would signal deeper correction
### Golden/Death Cross Analysis
**Current Status**:
- **50/200 SMA**: Golden Cross active (bullish)
- **20/50 SMA**: Death Cross developing (bearish short-term)
**Implications**:
- **Long-term**: Bull market intact
- **Short-term**: Corrective phase expected
---
## 11. MULTI-TIMEFRAME ANALYSIS
### 5-Minute Chart Analysis
**Trend**: Choppy, range-bound
**Range**: $116,500-$118,500
**Support**: $116,800 (recent lows)
**Resistance**: $118,200 (intraday highs)
**Volume**: Below average (consolidation)
**Pattern**: Symmetrical triangle
**Breakout**: Awaiting direction (slight bearish bias)
**Target Up**: $119,500
**Target Down**: $115,500
### 15-Minute Chart Analysis
**Trend**: Sideways to slightly bearish
**Pattern**: Descending triangle
**Support**: $117,000 (horizontal)
**Resistance**: $118,500-$119,000 (declining)
**Volume**: Decreasing (coiling for move)
**RSI**: Neutral (45-55 range)
**MACD**: Slight bearish bias
**Breakout Expected**: Within 6-12 hours
**Target**: $115,000 (if breaks down)
### 30-Minute Chart Analysis
**Trend**: Corrective within larger uptrend
**Structure**: ABC correction pattern
**A Wave**: $124,597 to $113,500
**B Wave**: $113,500 to $119,800 (complete)
**C Wave**: In progress, targeting $110,000-$114,000
**Time**: 2-4 hours for completion
**Volume**: Declining on bounces (bearish)
**Next Phase**: Reversal expected after C completion
### 1-Hour Chart Analysis
**Trend**: Bearish correction
**Elliott Wave**: Wave 4 of larger degree
**Pattern**: Complex corrective (WXY)
**Support**: $114,000-$116,000 (major)
**Resistance**: $120,000-$122,000 (key level)
**Ichimoku**: Below cloud (bearish)
**RSI**: Approaching oversold (40-45)
**Target**: $112,000-$115,000 (correction completion)
**Timeline**: 1-3 days
### 4-Hour Chart Analysis
**Primary Trend**: Bullish correction within uptrend
**Wave Structure**: Intermediate Wave (4)
**Pattern**: Double zigzag (W-X-Y)
**Current Phase**: Y wave of correction
**Support Zone**: $110,000-$115,000 (critical)
**Resistance Zone**: $122,000-$125,000 (major)
**Volume Profile**: Selling pressure evident
**Harmonic Patterns**: Multiple bearish patterns active
**Completion**: Expected within 3-7 days
### Intraday Summary (5M-1H)
**Overall Bias**: Bearish for next 12-24 hours
**Key Level**: $117,000 support break would accelerate down
**Target**: $114,000-$115,500 (initial)
**Resistance**: $119,000-$120,000 (strong)
**Strategy**: Fade bounces, buy oversold at support
---
## 12. SWING TRADING ANALYSIS (4H-Monthly)
### 4-Hour Swing Perspective
**Trend**: Corrective phase in larger uptrend
**Current Phase**: Wave (4) correction
**Structure**: Complex double zigzag
**Support**: $110,000-$115,000 (major confluence)
**Resistance**: $122,000-$125,000 (key breakout level)
**Pattern**: Large bull flag or pennant
**Volume**: Distribution characteristics
**Timeline**: 1-2 weeks for completion
**Target**: $135,000-$145,000 (after correction)
### Daily Swing Analysis
**Major Trend**: Secular bull market continuation
**Current Wave**: Primary degree Wave (4)
**Correction Type**: Time and price correction
**Expected Depth**: 15-25% ($105,000-$115,000)
**Duration**: 3-6 weeks total
**Support Confluence**: $108,000-$115,000
**Resistance**: $125,000-$130,000 (reclaim needed)
**Next Phase**: Final Wave (5) to new highs
**Ultimate Target**: $150,000-$200,000 (2026)
### Weekly Swing Analysis
**Super Trend**: Multi-year bull market
**Current Cycle**: Wave III of larger degree
**Phase**: Late-stage correction before final push
**Major Support**: $85,000-$105,000 (weekly demand)
**Major Resistance**: $130,000-$140,000 (weekly supply)
**Seasonal Factor**: Q4 historically strong for Bitcoin
**Institutional Flow**: Continued adoption trend
**Long-term View**: $200,000+ by 2026-2027
### Monthly Swing Analysis
**Decade Trend**: Exponential adoption curve
**Current Position**: Mid-cycle bull run
**Cycle Stage**: Institutional adoption phase
**Monthly Support**: $75,000-$90,000 (major crash protection)
**Monthly Resistance**: $150,000-$200,000 (cycle targets)
**Fundamental Backdrop**: Growing ETF adoption, corporate treasury
**Regulatory Environment**: Increasingly favorable
**Ultimate Targets**: $500,000-$1,000,000 (2030s)
### Swing Trading Strategy
**Accumulation Approach**:
- **Entry Range**: $105,000-$120,000 (scale in)
- **Core Position**: 70% in range
- **Breakout Addition**: 30% above $130,000
- **Stop Loss**: $95,000 (major trend invalidation)
- **Target Sequence**: $135,000 → $155,000 → $180,000
- **Timeline**: 6-18 months
**Risk Management**:
- **Position Size**: 5-15% of portfolio (based on risk tolerance)
- **Diversification**: Consider Bitcoin miners, crypto ETFs
- **Hedge Options**: Put options for downside protection
---
## 13. KEY LEVELS & PRICE TARGETS
### Critical Support Levels (Priority Order)
1. **$116,000-$117,500** - Immediate support (current area)
2. **$114,000-$115,500** - Minor support (harmonic targets)
3. **$110,000-$113,000** - Moderate support (Elliott Wave targets, VWAP -1σ)
4. **$105,000-$108,000** - Major support (Elliott Wave 61.8%, Bollinger lower band)
5. **$95,000-$100,000** - Critical support (previous Wave 1 high, psychological)
6. **$85,000-$90,000** - Ultimate support (Gann angles, monthly demand)
### Critical Resistance Levels (Priority Order)
1. **$119,000-$120,000** - Immediate resistance (VWAP, previous support)
2. **$122,000-$125,000** - Minor resistance (harmonic retracements, MA cluster)
3. **$127,000-$130,000** - Moderate resistance (Bollinger upper, psychological)
4. **$135,000-$140,000** - Major resistance (Elliott Wave 5 targets)
5. **$150,000-$155,000** - Strong resistance (extended Elliott targets)
6. **$180,000-$200,000** - Ultimate resistance (super cycle projections)
### Short-term Targets (Next 1-4 weeks)
**Bearish Scenario** (65% probability):
- **Initial**: $114,000-$116,000 (correction continuation)
- **Extended**: $108,000-$112,000 (deeper correction)
- **Extreme**: $105,000-$108,000 (maximum correction)
**Bullish Scenario** (35% probability):
- **Breakout**: Above $122,000 (correction failure)
- **Target**: $130,000-$135,000 (resumption higher)
- **Extended**: $140,000-$145,000 (accelerated move)
### Medium-term Targets (Next 1-6 months)
**After Correction Completion**:
- **Wave 5 Minimum**: $135,000-$145,000
- **Wave 5 Extended**: $155,000-$165,000
- **Wave 5 Extreme**: $180,000-$200,000
- **Timeline**: December 2025 - March 2026
### Long-term Targets (6-24 months)
**Super Cycle Completion**:
- **Conservative**: $200,000-$250,000
- **Moderate**: $300,000-$400,000
- **Aggressive**: $500,000-$750,000
- **Timeline**: 2026-2027
---
## 14. VOLUME ANALYSIS & MARKET STRUCTURE
### Volume Profile Analysis
**High Volume Nodes (Value Areas)**:
- **Primary Node**: $85,000-$95,000 (28% of volume - major support)
- **Secondary Node**: $105,000-$115,000 (22% of volume - current battle zone)
- **Tertiary Node**: $65,000-$75,000 (18% of volume - deep support)
**Point of Control (POC)**: $89,500 (highest volume level)
**Value Area High (VAH)**: $118,000 (fair value upper bound)
**Value Area Low (VAL)**: $72,000 (fair value lower bound)
### Volume Trend Analysis
**Recent Volume Characteristics**:
- **New High Volume**: Extremely high at $124,597 (climactic)
- **Decline Volume**: Above average (selling pressure)
- **Bounce Volume**: Below average (weak demand)
- **Current Trend**: Declining volume on bounces (bearish)
### On-Balance Volume (OBV)
**Trend Analysis**:
- **Recent Peak**: At all-time highs (confirming price)
- **Current Action**: Declining with price
- **Divergence**: No major divergence yet
- **Next Signal**: Break below June OBV levels would be bearish
### Volume Oscillators
**Chaikin Money Flow (CMF)**:
- **Current Reading**: -0.25 (distribution)
- **Trend**: Declining from positive territory
- **Signal**: Below -0.20 confirms selling pressure
**Volume Rate of Change (VROC)**:
- **Current**: +75% (well above average)
- **Pattern**: High volume associated with decline
- **Implication**: Professional distribution occurring
### Accumulation/Distribution Line
**Current Trend**: Declining (distribution phase)
**Recent Action**: Sharp decline from highs
**Divergence**: Confirming price action
**Signal**: Recovery above recent highs needed for bullish confirmation
---
## 15. MARKET SENTIMENT & INTERMARKET ANALYSIS
### Bitcoin Sentiment Indicators
**Fear & Greed Index**: 25 (Fear territory)
- **Recent Change**: From Extreme Greed (85) to Fear
- **Historical Pattern**: Fear levels often mark good buying opportunities
- **Contrarian Signal**: Current fear suggests potential bottom formation
### Institutional Activity
**ETF Flows**:
- **Recent Trend**: Net outflows during correction
- **Major Players**: BlackRock, Fidelity showing mixed flows
- **Institutional Sentiment**: Cautious after rapid gains
**Corporate Treasury Activity**:
- **MicroStrategy**: Continues accumulation strategy
- **Other Corporates**: Reduced activity at current levels
- **Sovereign Wealth**: Exploratory positions being built
### Correlation Analysis
**Traditional Markets**:
- **S&P 500 Correlation**: 0.45 (moderate positive)
- **Gold Correlation**: -0.15 (slight negative)
- **DXY Correlation**: -0.65 (strong negative)
- **10-Year Treasury**: -0.35 (moderate negative)
**Crypto Market**:
- **Ethereum Correlation**: 0.88 (very strong)
- **Altcoin Correlation**: 0.75 (strong)
- **Market Dominance**: 52.5% (stable)
### Macroeconomic Environment
**Federal Reserve Policy**:
- **Current Stance**: Accommodative
- **Rate Environment**: Supportive for risk assets
- **Forward Guidance**: Stable policy expected
**Global Liquidity**:
- **USD Liquidity**: Ample
- **Cross-border Flows**: Improving
- **Risk Appetite**: Recovering from recent caution
---
## 16. DERIVATIVES & OPTIONS ANALYSIS
### Futures Market Structure
**Contango/Backwardation**:
- **Current Structure**: Slight contango (normal)
- **3-Month Basis**: +2.1% annualized
- **6-Month Basis**: +4.8% annualized
- **Trend**: Normalizing from extreme levels
### Options Market
**Put/Call Ratio**: 1.45 (elevated fear)
**Implied Volatility**: 68% (high but declining from 85%)
**Volatility Term Structure**: Steep (near-term elevated)
**Key Option Strikes**:
- **$120,000 Calls**: Heavy resistance
- **$110,000 Puts**: Major support
- **$100,000 Puts**: Psychological support
### Perpetual Swaps
**Funding Rates**: -0.02% (slightly negative)
**Open Interest**: Declining (position unwinding)
**Long/Short Ratio**: 55/45 (slight bullish bias)
---
## 17. RISK ASSESSMENT & SCENARIOS
### Primary Scenario - Continued Correction (65% Probability)
**Process**: Elliott Wave (4) completion
**Timeline**: 2-4 weeks additional correction
**Target Zone**: $108,000-$115,000
**Catalyst**: Technical correction, profit-taking
**Risk Factors**: Deeper than expected correction
**Trading Strategy**:
- **Wait for oversold levels**: RSI <40, price <$112,000
- **Scale in gradually**: 25% positions every $3,000 decline
- **Stop loss**: Below $95,000 (trend invalidation)
### Secondary Scenario - Correction Failure (25% Probability)
**Process**: V-bottom reversal from current levels
**Catalyst**: Strong institutional buying, ETF inflows
**Timeline**: 1-2 weeks to new highs
**Target**: $130,000-$140,000 initially
**Risk**: False breakout leading to deeper correction
**Trading Strategy**:
- **Breakout Entry**: Above $122,000 with volume
- **Stop Loss**: $115,000
- **Target**: $135,000 initial
### Bear Scenario - Major Correction (10% Probability)
**Process**: Larger degree Wave 4 correction
**Catalyst**: Regulatory concerns, macro shock
**Timeline**: 2-6 months
**Target Zone**: $85,000-$95,000
**Probability**: Low due to strong adoption trends
**Risk Management**:
- **Hard Stop**: $95,000 (major trend break)
- **Position Sizing**: Reduce exposure significantly
- **Hedging**: Consider put options
---
## 18. TRADING STRATEGIES & EXECUTION
### Scalping Strategy (5M-15M timeframes)
**Market Hours**: Focus on high liquidity periods
**Range Trading**:
- **Buy**: $116,500-$117,000 (support bounces)
- **Sell**: $118,500-$119,000 (resistance)
- **Stop**: $300-500 outside range
- **Target**: $800-1,200 profit per trade
**Breakout Scalping**:
- **Long Setup**: Break above $119,000 with volume
- **Short Setup**: Break below $116,000 with volume
- **Risk/Reward**: 1:2 minimum ratio
### Day Trading Strategy (15M-1H timeframes)
**Trend Following Setup**:
- **Entry**: Direction of 1H trend with RSI confirmation
- **Stop**: Beyond recent swing high/low
- **Target**: Next significant resistance/support
- **Position Size**: 1-2% risk per trade
**Mean Reversion Setup**:
- **Entry**: Extreme RSI levels (>70 or <30)
- **Direction**: Counter-trend back to mean
- **Stop**: New extreme in same direction
- **Target**: VWAP or key moving average
### Swing Trading Strategy (4H-Daily timeframes)
**Correction Completion Setup**:
- **Entry Zone**: $108,000-$115,000 (scale in)
- **Confirmation**: RSI oversold + bullish divergence
- **Stop Loss**: $95,000 (major support break)
- **Target 1**: $125,000 (25% position)
- **Target 2**: $140,000 (50% position)
- **Target 3**: $160,000 (25% position)
- **Timeline**: 3-12 months
**Position Management**:
- **Initial Risk**: 3-5% of portfolio
- **Add on weakness**: Up to 10% total allocation
- **Trail stops**: Below major swing lows
- **Profit taking**: At resistance confluences
### Long-term Investment Strategy (Weekly-Monthly)
**Dollar Cost Averaging**:
- **Allocation**: 5-20% of investment portfolio
- **Frequency**: Weekly or monthly purchases
- **Range**: Accumulate heavily below $120,000
- **Reduce**: Above $150,000
- **Target**: 5-10 year hold period
**Strategic Accumulation**:
- **Phase 1**: Current correction ($105,000-$120,000)
- **Phase 2**: Major correction if occurs ($85,000-$105,000)
- **Hold Through**: All intermediate volatility
- **Exit Strategy**: Partial above $200,000
---
## 19. ADVANCED PATTERN RECOGNITION
### Fractal Analysis
**Current Fractal Structure**:
- **Major Fractal**: 2020-2025 bull market cycle
- **Intermediate Fractal**: March 2024 - Present wave structure
- **Minor Fractal**: August 2025 correction pattern
- **Micro Fractal**: Daily price action patterns
**Fractal Projections**:
- **Self-similarity**: Current correction mirrors March 2024 structure
- **Time Ratios**: 0.618 and 1.618 Fibonacci relationships
- **Price Ratios**: Similar percentage corrections expected
### Market Geometry
**Sacred Geometry Levels**:
- **Golden Ratio Points**: $108,697 (61.8% correction)
- **Phi Projections**: $138,449 (1.618 extension)
- **Square Root Relationships**: Key support/resistance
### Cycle Harmonics
**Price Cycle Analysis**:
- **210-Day Cycle**: Major intermediate cycle
- **89-Day Cycle**: Current correction cycle
- **34-Day Cycle**: Short-term turning points
- **Confluence**: Multiple cycles bottoming late August
---
## 20. FINAL SYNTHESIS & RECOMMENDATIONS
### Technical Confluence Assessment
**Overall Score**: 7.1/10 (Moderately Bearish Near-term, Bullish Long-term)
**Bearish Factors** (Near-term):
- Elliott Wave (4) correction in progress
- Multiple harmonic patterns targeting lower levels
- Wyckoff distribution characteristics
- Candlestick reversal patterns at highs
- RSI and momentum indicators declining
**Bullish Factors** (Medium/Long-term):
- Secular bull market structure intact
- Strong volume support at lower levels
- Institutional adoption continuing
- Favorable macro environment
- Historical cycle patterns supportive
### Primary Trading Recommendation
**Strategy**: Patience for better entry opportunities
**Current Assessment**: Wait for correction completion
**Preferred Entry**: $108,000-$115,000 (scale in approach)
**Risk Management**: Hard stop below $95,000 (major trend invalidation)
**Target Sequence**: $125,000 → $140,000 → $165,000 → $200,000+
**Timeline**: 6-18 months for major targets
### Tactical Approach by Timeframe
**Intraday (Next 1-7 days)**:
- **Bias**: Bearish to neutral
- **Strategy**: Fade bounces, wait for oversold
- **Key Levels**: $117,000 support, $120,000 resistance
- **Risk**: High volatility expected
**Swing (Next 2-8 weeks)**:
- **Bias**: Bearish then bullish
- **Strategy**: Accumulate on weakness below $115,000
- **Target**: Correction completion then reversal
- **Risk**: 15-25% downside possible
**Position (Next 3-12 months)**:
- **Bias**: Strongly bullish
- **Strategy**: Build core positions on any weakness
- **Target**: New all-time highs $150,000-$200,000
- **Risk**: Major trend change below $85,000
### Portfolio Allocation Recommendations
**Conservative Investors**:
- **Current Allocation**: 2-5% (wait for lower levels)
- **Target Allocation**: 5-10% (on correction completion)
- **Strategy**: DCA approach, ETF exposure preferred
**Moderate Risk Investors**:
- **Current Allocation**: 5-10% (begin scaling)
- **Target Allocation**: 10-15% (full position on weakness)
- **Strategy**: Swing trading with core position
**Aggressive Traders**:
- **Current Allocation**: 10-15% (active trading)
- **Target Allocation**: 15-25% (leveraged strategies possible)
- **Strategy**: Full spectrum trading across timeframes
### Risk Management Framework
**Position Sizing**:
- **Maximum Risk**: 20% portfolio (aggressive)
- **Moderate Risk**: 10-15% portfolio
- **Conservative**: 5% portfolio maximum
**Stop Loss Strategy**:
- **Tight Stops**: Day trading (2-5%)
- **Swing Stops**: Major support breaks (10-15%)
- **Position Stops**: Trend invalidation (20-25%)
**Profit Taking**:
- **Scale out**: At major resistance levels
- **Trail stops**: Below significant support levels
- **Long-term holds**: Multi-year perspective
---
## CONCLUSION
Bitcoin stands at a critical juncture following the recent all-time highs above $124,500. The comprehensive technical analysis across multiple methodologies strongly suggests a corrective phase is underway, presenting both challenges and opportunities for different trading approaches.
**Key Findings**:
1. **Elliott Wave analysis** indicates Wave (4) correction targeting $108,000-$115,000
2. **Harmonic patterns** confirm potential deeper pullback before resumption
3. **Wyckoff method** shows distribution characteristics but within larger accumulation
4. **Gann analysis** supports both correction targets and longer-term bullish projections
5. **Traditional indicators** confirm corrective phase with oversold bounce opportunities
**Strategic Outlook**:
The analysis strongly favors patience in the near-term, allowing the current correction to complete before establishing significant long positions. The secular bull market remains intact, and any weakness below $115,000 should be viewed as an accumulation opportunity for the next major leg higher toward $150,000-$200,000+ targets.
**Final Recommendation**:
Maintain a constructively bullish medium-term outlook while respecting the current corrective phase. Use any weakness below $115,000 as an opportunity to build positions for the anticipated final wave higher in this major cycle, expected to begin in Q4 2025 or Q1 2026.
For those interested in further developing their trading skills based on these types of analyses, consider exploring the mentoring program offered by Shunya dot Trade.(world wide web shunya dot trade)
I welcome your feedback on this analysis, as it will inform and enhance my future work.
Regards,
Shunya.Trade
world wide web shunya dot trade
⚠️ Disclaimer: This post is educational content and does not constitute investment advice, financial advice, or trading recommendations. The views expressed here are based on technical analysis and are shared solely for informational purposes. The stock market is subject to risks, including capital loss, and readers should exercise due diligence before investing. We do not take responsibility for decisions made based on this content. Consult a certified financial advisor for personalized guidance.
I am nothing
Disclaimer
The information and publications are not meant to be, and do not constitute, financial, investment, trading, or other types of advice or recommendations supplied or endorsed by TradingView. Read more in the Terms of Use.
I am nothing
Disclaimer
The information and publications are not meant to be, and do not constitute, financial, investment, trading, or other types of advice or recommendations supplied or endorsed by TradingView. Read more in the Terms of Use.