This Analysis coincides with the Bitcoin analysis I posted earlier today that is link below.
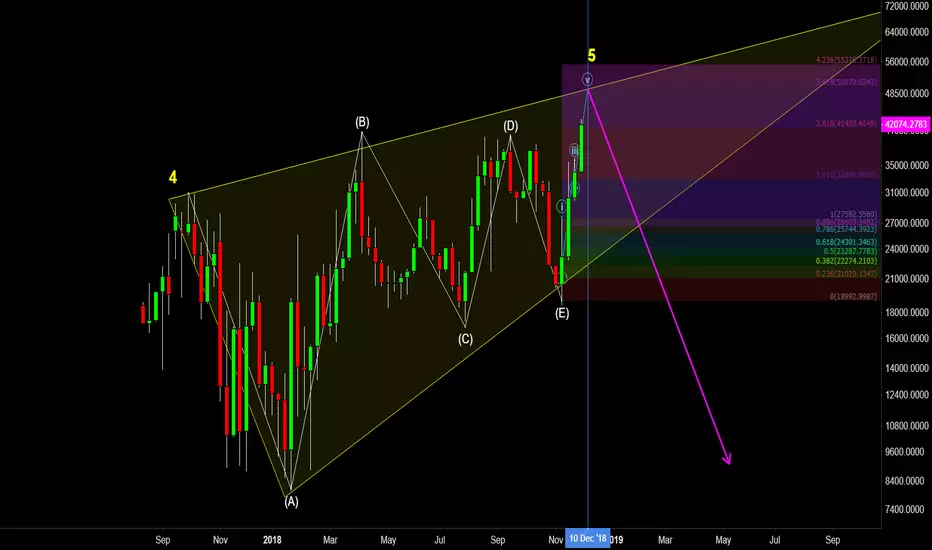
Shorts are wedging to an apex with, what I count as an ABCDE Diagonal, representative of a Wave 4, with the current swing high being the 5th Wave, leading up to a reversal...


Fibonacci Extension ratios align with this premise...

And Wave 5 Wedging towards an apex...that aligns with my December 10, 2018 Bull Run analysis...


Which all leads to a reversal, meaning that the number of Shorts will drop drastically and traders will be going Long...

Shorts are wedging to an apex with, what I count as an ABCDE Diagonal, representative of a Wave 4, with the current swing high being the 5th Wave, leading up to a reversal...
Fibonacci Extension ratios align with this premise...
And Wave 5 Wedging towards an apex...that aligns with my December 10, 2018 Bull Run analysis...
Which all leads to a reversal, meaning that the number of Shorts will drop drastically and traders will be going Long...
Note
The '4' is misplaced, it should be at the bottom below (A).Note
Being that my calculations for this fall on the Weekly, it must be assumed that the move up will begin towards the end of this week. This is my updated count...
Note
I was looking for Shorts to pick back up today...And there they are...
Note
Note
Shorts building again with a possible Cup & Handle, but I expect a top to be reached coinciding with a Bull Run to the 5000-5400 range for a Wave 4 on BTC (as seen below).Note
Shorts rising...Note
Exhibit A:Now lets watch...
Note
This little hammer here spells trouble for the bulls...Note
Been looking for this Gap to get filled...And there it is...
Note
Note
Another Gap to be filled...Note
I have found the following Indicator Baseline settings to be the most accurate...just sharing, test for yourself: Stochastic RSI - 95/05; RSI - 75/25; Godmode - 80/20.Note
Note
Related publications
Disclaimer
The information and publications are not meant to be, and do not constitute, financial, investment, trading, or other types of advice or recommendations supplied or endorsed by TradingView. Read more in the Terms of Use.
Related publications
Disclaimer
The information and publications are not meant to be, and do not constitute, financial, investment, trading, or other types of advice or recommendations supplied or endorsed by TradingView. Read more in the Terms of Use.