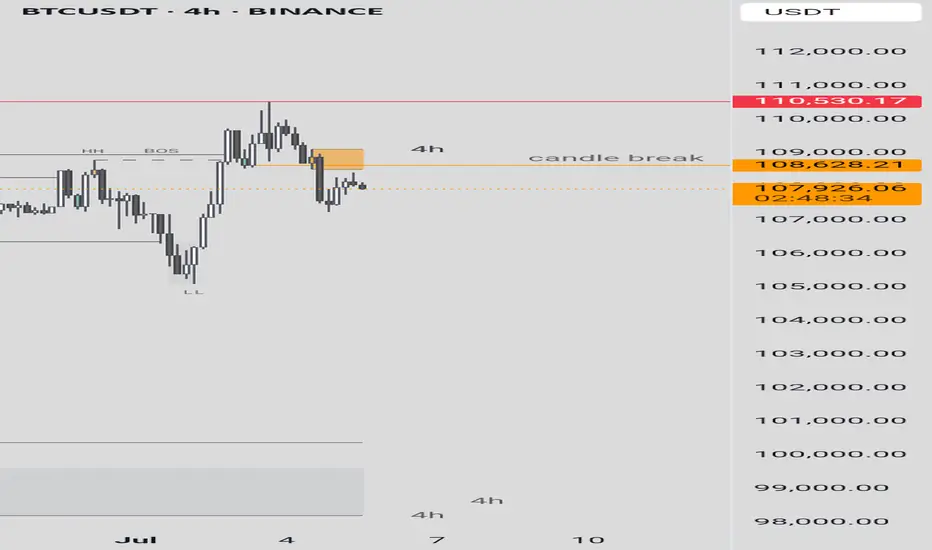
This is a 4-hour candlestick chart for BTCUSDT on Binance, covering the period from June 4 to July 4, 2025. The chart includes technical analysis annotations such as:Higher Highs (HH) and Higher Lows (LH) indicating an uptrend.Lower Highs (LH) and Lower Lows (LL) suggesting a potential downtrend or consolidation.CHOCH (Change of Character) marking a shift in market structure.BOS (Break of Structure) indicating a break in the previous trend.A red horizontal line at 110,530.17, possibly a resistance level.An orange dashed line around 108,259.99, possibly a key support or pivot level.Price levels on the right (e.g., 110,530.17, 108,628.21) showing recent highs and the current price at 01:01:45.The chart shows a recent upward movement followed by a sharp drop, with the price currently near 105,000. This could indicate a rejection at resistance or a breakout attempt.
Overall, the market is currently trending down in the short term, but there is a chance for a comeback if support holds. Monitor the key levels of 105,000 and 102,500 for further confirmation.
Overall, the market is currently trending down in the short term, but there is a chance for a comeback if support holds. Monitor the key levels of 105,000 and 102,500 for further confirmation.
Disclaimer
The information and publications are not meant to be, and do not constitute, financial, investment, trading, or other types of advice or recommendations supplied or endorsed by TradingView. Read more in the Terms of Use.
Disclaimer
The information and publications are not meant to be, and do not constitute, financial, investment, trading, or other types of advice or recommendations supplied or endorsed by TradingView. Read more in the Terms of Use.