We’ve all heard trading terms like Major Trend and Major Counter-Trend levels. These are zones where price either breaks through and continues (Trend Levels) or sharply reverses (Counter-Trend Levels). In the crypto world, these levels are often separated by enormous gaps, due to the nature of the space — as I’ve mentioned in a previous idea: Crypto Charts Whisper—Are You Listening?
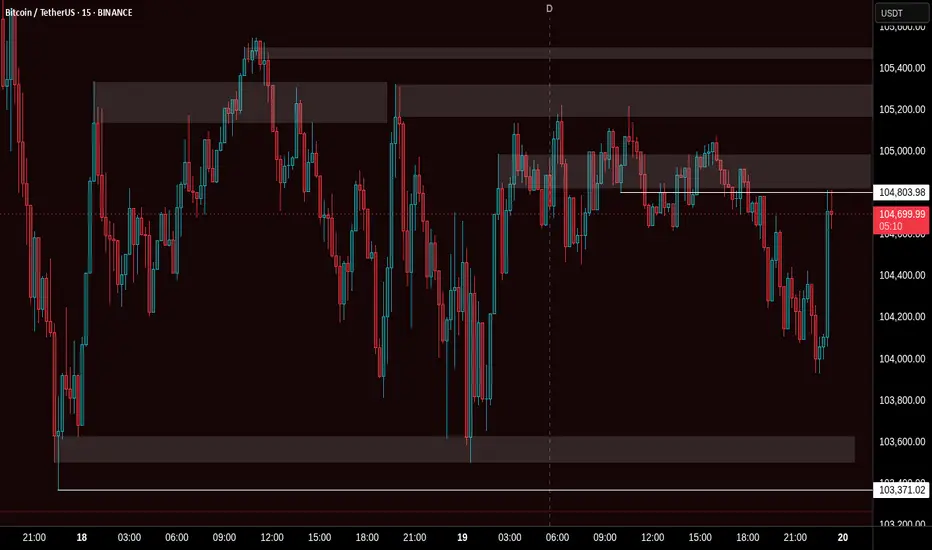
Let’s get one thing clear from the start. These levels are not just thin lines that traders casually draw across a chart. They are zones. So, as a skilled trader, anytime someone mentions support or resistance, keep in mind: interact with these as zones, not levels.
Why? The answer lies in the nature of the candlestick itself. Most support and resistance areas — 99% of the time — are defined by candlesticks such as inverted hammers, shooting stars, etc. For instance, in an uptrend near its peak, you’ll often spot an inverted hammer with a rejection wick that’s at least 25–50% of the candle’s body. The longer the wick, the stronger the rejection. In that sense, the high and the close of that candle form the zone. And what better tool to use for this than the rectangle?
Now, to slowly return to our main point — many of you might’ve noticed that zones often change their nature, especially resistance zones. If you’re experienced, you already know: price tends to go higher by nature. So when a counter-trend zone gets broken and price pushes above it, it shifts — it becomes a trend zone. Later, if price retests it from above, it often turns into support, and with another reversal, it can shift again — becoming a counter-trend zone once more.
But my point goes deeper than what you’ll hear in lessons or YouTube videos. Like I said in another post — A Follow-up to “Adjustments for Better Readings & VSA vs BTC” — if it’s already out there, it’s probably old news.
A skilled trader keeps an open mind — merging everything into one system. And it's part of this oneness mindset that elite traders follow, which I want to share now.
So I ask you:
What if the idea of trend and counter-trend zones didn’t just apply to major levels?
What if this concept applied everywhere on the chart?
For me, this isn’t just a question anymore — it’s a fact. A fact that made me a better trader. I won’t lie — before I got good at this, I failed over and over. But I never quit. That’s not the point though. The point is to expand your vision and train yourself to react just like the elite do.
Take double or triple tops/bottoms — standard or rounded. These formations also act exactly like trend and counter-trend zones. And they stay relevant well into the future. Every level is tested at least twice, from both directions. Maybe not immediately, but eventually — across multiple time frames.
And just like that, a level becomes a major zone for future use — especially if you trade across multiple time frames. So be careful: if you’re only looking at the 1-hour chart, you might miss something important that’s playing out on the 3-minute. And that can trigger psychological discomfort... leading to FOMO — and all the mistakes that come with it.
Also remember — double and triple tops/bottoms are zones, not exact lines. Many traders lose trades by a single tick, just because they forget that rule.
Let’s go a bit deeper now.
Think about all the small highs and lows that appear between those tops and bottoms on a 3-minute chart.
How can they help you trade better? The answer goes back to my previous idea: Location, Location, Location — Consistency and Alignment.
I get it — staying observant 24/7 is hard. That’s why institutions and big players work in teams, in shifts. They’re never alone. You shouldn’t be either.
There’s a lot more that could be said about these levels and zones — how they reveal future trend behavior, a flow! even without indicators or VSA. It has to do with how specific highs and lows behave at certain points in time... but let’s leave that for now.
For the outro, remember this:
The real edge isn’t in indicators.
It’s in your ability to catch the flow of price,
And to read strength or weakness through the simple structures within the zones Big Players create — whether visible or hidden.
A chart isn’t a single truth.
It’s a battlefield of conflicting zones and mixed signals.
If this mindset resonates with you and you want to go deeper — whether it’s building confidence or spotting hidden signals early — I work with a small circle of traders, sharing TA privately every day. Feel free to reach out.
Until next time, be well and trade wisely.
Disclaimer
The information and publications are not meant to be, and do not constitute, financial, investment, trading, or other types of advice or recommendations supplied or endorsed by TradingView. Read more in the Terms of Use.
Disclaimer
The information and publications are not meant to be, and do not constitute, financial, investment, trading, or other types of advice or recommendations supplied or endorsed by TradingView. Read more in the Terms of Use.