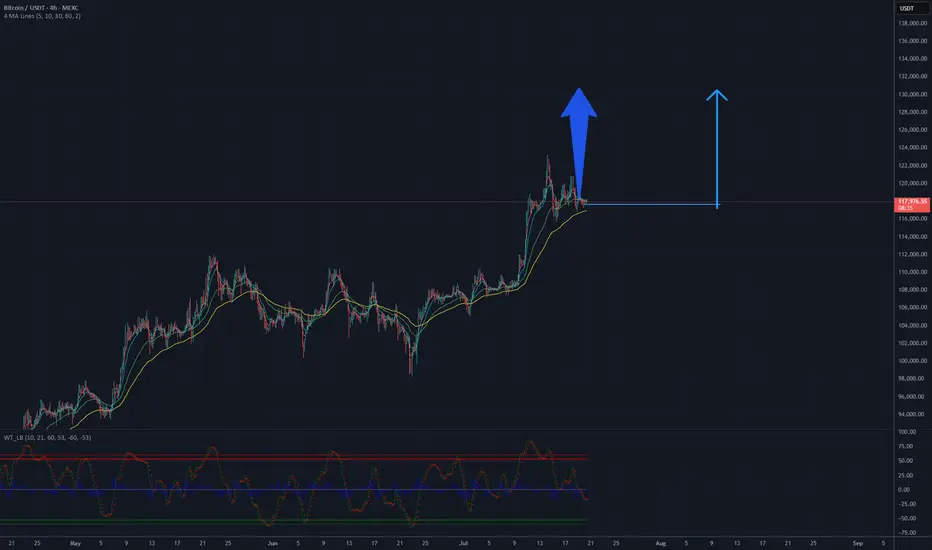
Analysis of the Bitcoin (BTC/USDT) chart on the MEXC platform indicates a positive upward trend. The price is currently hovering around $117,823, with clear support at approximately $100,000, as confirmed by the lower channel line. Moving averages (MA) suggest a sustained upward trend, and the trend line drawn from the lows points to potential for further growth. The current resistance is in the $120,000-$125,000 range, but if momentum holds and this level is breached, the price could head toward $130,000 in the short to medium term. It is recommended to monitor volume and key support and resistance levels to confirm further upward movement.
Potential TP: 130 000 $
Potential TP: 130 000 $
Disclaimer
The information and publications are not meant to be, and do not constitute, financial, investment, trading, or other types of advice or recommendations supplied or endorsed by TradingView. Read more in the Terms of Use.
Disclaimer
The information and publications are not meant to be, and do not constitute, financial, investment, trading, or other types of advice or recommendations supplied or endorsed by TradingView. Read more in the Terms of Use.