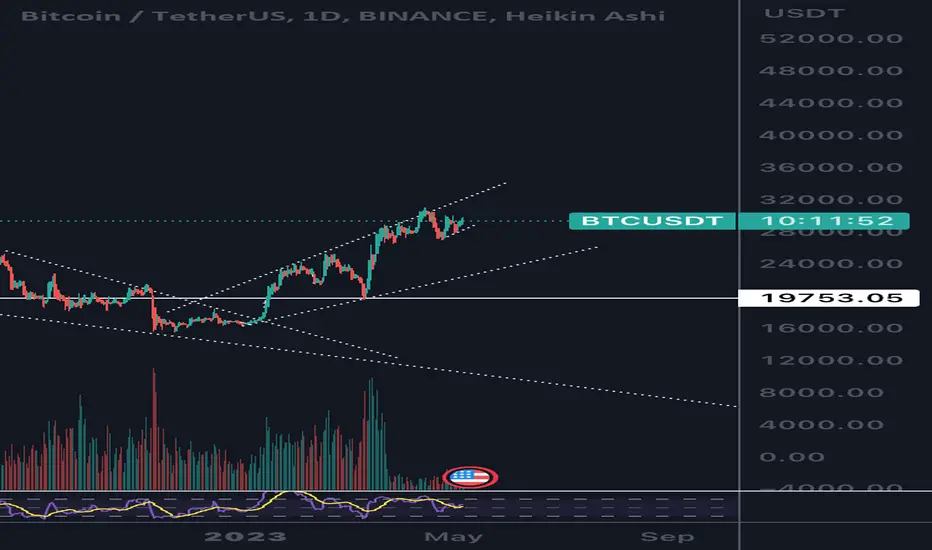
Although Btc could
Blast out of this symetrical triangle at the top, it is supported between 29.8 and 28.1. We have shown some serious support as 27 k there is a lot of similarities to a rising brodening wedge
If this was to break 27k and flip to reistance this pattern over sometime could take Btc down towards 25/24k. Now of course what happens at that 25/24 k can be bullish and bounce heavily off that support but if it does this and breaks down from 25/24 k then going back to retest the base of 19.7k wouldn’t be out of the question.
Calling momentum shifts is so tough and it’s easy to get caught up in the bullish price action. This idea could be wrong if we pop and hold 30k then we blast to the next target of 33k and then lead this pattern to downside if this upper sloping reistance contiues to act as such.
a few things we can do - short 29,8 and stoploss above 30.2
Or we can wait for a 28k break and hold and show reistance then we have to wait for 27k to break as well and hold. The safest entry from here is potentially 27k breakdown and reistance. Howver if you bearish you an just defend the 29.9-30k reistance. And stoploss above
Disclaimer
The information and publications are not meant to be, and do not constitute, financial, investment, trading, or other types of advice or recommendations supplied or endorsed by TradingView. Read more in the Terms of Use.
Disclaimer
The information and publications are not meant to be, and do not constitute, financial, investment, trading, or other types of advice or recommendations supplied or endorsed by TradingView. Read more in the Terms of Use.