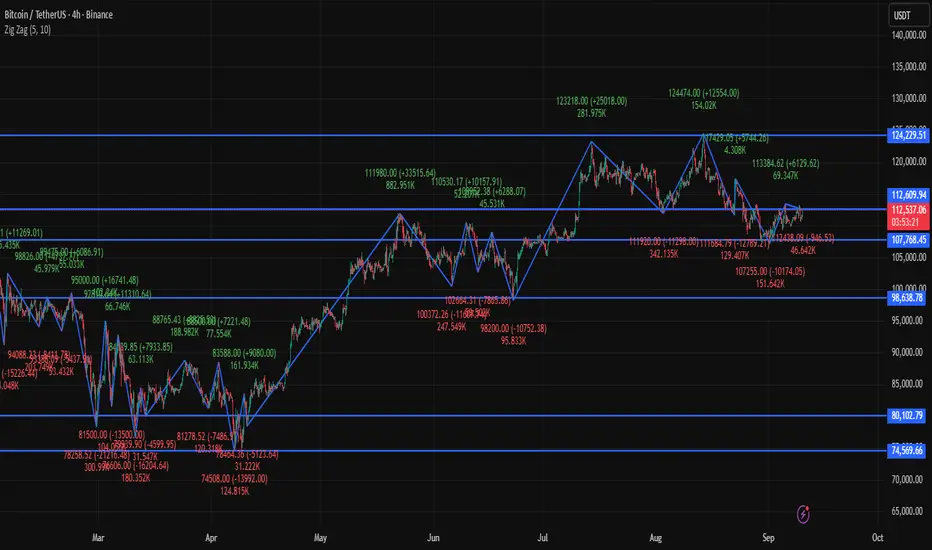
📊 BTC/USDT Snapshot
Current Price: ~$112,419
Range (Intraday): $110,812 – $113,138
Change: Around –0.5% from the last close
🔎 Key Levels (4-Hour Focus)
Support Zone: ~$106,000 (recent double-bottom area)
Current Pivot: ~$112,000 (key resistance and decision zone)
Next Resistance: ~$117,000 (if breakout holds)
📉 Technical Indicators (4-Hour Context)
RSI: In the mid-50s → showing moderate strength after bounce
MACD: Slightly positive → early bullish signal
Momentum: Neutral to bullish; recovery attempt underway
📌 4-Hour Outlook
Bullish Case: If BTC closes firmly above $112,000, it could push toward $117,000.
Bearish Case: If rejection happens at $112,000, price may slip back toward $110,000 → $106,000 support.
Bias: Consolidation with bullish potential, but resistance needs to be cleared.
✅ Conclusion: On the 4-hour chart, BTC/USDT is in a neutral-to-bullish phase, holding above its recent bottom. $112K is the key battleground — breakout could fuel upside momentum, while rejection risks another retest lower.
Disclaimer
The information and publications are not meant to be, and do not constitute, financial, investment, trading, or other types of advice or recommendations supplied or endorsed by TradingView. Read more in the Terms of Use.
Disclaimer
The information and publications are not meant to be, and do not constitute, financial, investment, trading, or other types of advice or recommendations supplied or endorsed by TradingView. Read more in the Terms of Use.