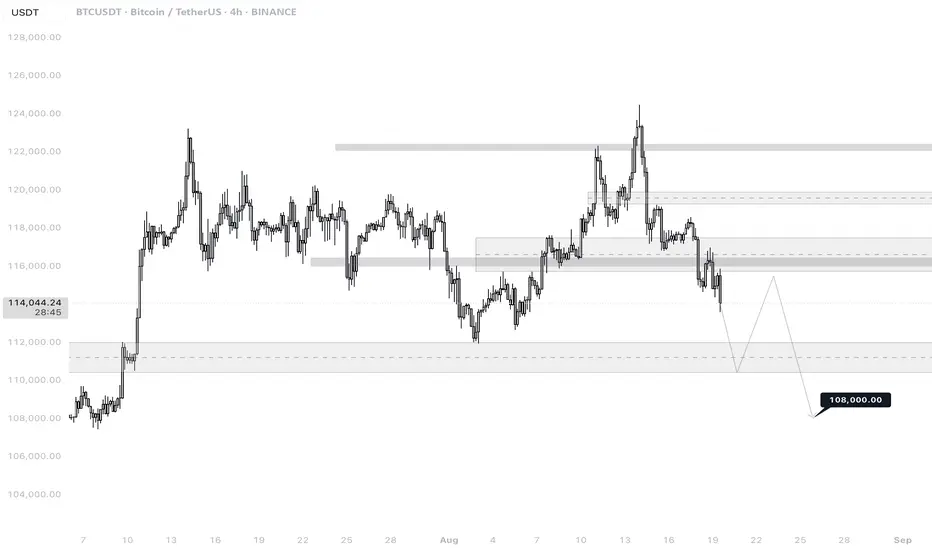
🔎 Chart Context
• Pair: BTC/USDT
• Exchange: Binance
• Timeframe: 4H (240M)
• Date: 19 August 2025
This chart is mapped using liquidity zones, supply/demand levels, and structural market shifts to project BTC’s likely next move.
📊 Key Observations
1. Current Price Action
• BTC is trading around 114,050, following a sharp decline from the 124,000–125,000 resistance zone.
• The structure shifted bearish after rejection from the upper supply block.
• Current momentum is pushing toward deeper demand levels.
2. Support & Demand Zones
• 112,000–111,000: Nearest significant demand zone; previously acted as strong support after July accumulation.
• 108,000: Major liquidity target marked on the chart — a strong confluence area where large stop orders and institutional bids are likely to be placed.
3. Resistance Zones
• 118,000–119,000: Nearest overhead supply zone; likely to act as resistance on any short-term bounce.
• 124,000–125,000: Major resistance block that caused the latest rejection.
4. Liquidity Behavior
• BTC has already swept liquidity at 116,000–115,000 zone, triggering further downside.
• Liquidity magnets now sit lower, especially at 108,000, which is the projection target.
• Expect volatility as price interacts with the 111,000–112,000 demand block.
5. Projected Path
• Base case scenario (drawn on chart):
• Drop into 111,000–112,000 demand zone.
• Relief bounce toward 116,000–118,000 (supply retest).
• Continuation lower into 108,000 liquidity sweep.
📈 Bullish Case (Lower Probability, Countertrend)
• If BTC holds 112,000–111,000 demand zone strongly and invalidates supply at 118,000–119,000:
• First target: 120,000.
• Second target: 124,000–125,000 retest.
• Requires strong volume and supportive macro flows (e.g., USD weakness, strong equities).
📉 Bearish Case (Higher Probability)
• Structure favors downside continuation.
• Path:
• Retest of 116,000–118,000 supply zone (failed rally).
• Breakdown continuation to 108,000 liquidity target.
• This scenario aligns with broader DXY/EURUSD outlook where USD remains weak short-term but BTC could still flush liquidity before next bullish cycle.
⚡ Trading Plan
• Short Bias (Preferred Play):
• Entry: Relief rallies into 116,000–118,000.
• TP1: 112,000
• TP2: 108,000
• Stop: Above 120,000
• Long Setup (Risky, Countertrend):
• Entry: 111,000–112,000 demand zone.
• TP: 118,000
• Stop: Below 108,000
Related publications
Disclaimer
The information and publications are not meant to be, and do not constitute, financial, investment, trading, or other types of advice or recommendations supplied or endorsed by TradingView. Read more in the Terms of Use.
Related publications
Disclaimer
The information and publications are not meant to be, and do not constitute, financial, investment, trading, or other types of advice or recommendations supplied or endorsed by TradingView. Read more in the Terms of Use.