Predicting the market requires skill.
Most traders fail at one crucial point: they don’t see the market as a living, breathing organism—a structure where one move leads to another, like cause and effect in motion.
That’s what we often call reading the psychology of the market. When you begin to grasp the fundamental principles behind that, you step into the realm of elite traders.
And yes—Volume Spread Analysis (VSA) is a powerful tool, but only if you know how to read it properly.
I’m not a certified trader or financial advisor, and I don’t give signals, entries, or exits. I’m simply a solo observer, sharing a slice of what true technical and fundamental analysis looks like.
And yes—it takes time. It takes skills. Now, if we want to even attempt predicting the future of price action, we must understand something: A chart is not a single truth. It’s a battlefield of conflicting signals.
Patterns, marks, levels—some suggest bullish continuation, others hint at sharp reversals. Confusion is inevitable if you don’t learn to distinguish which signs matter.
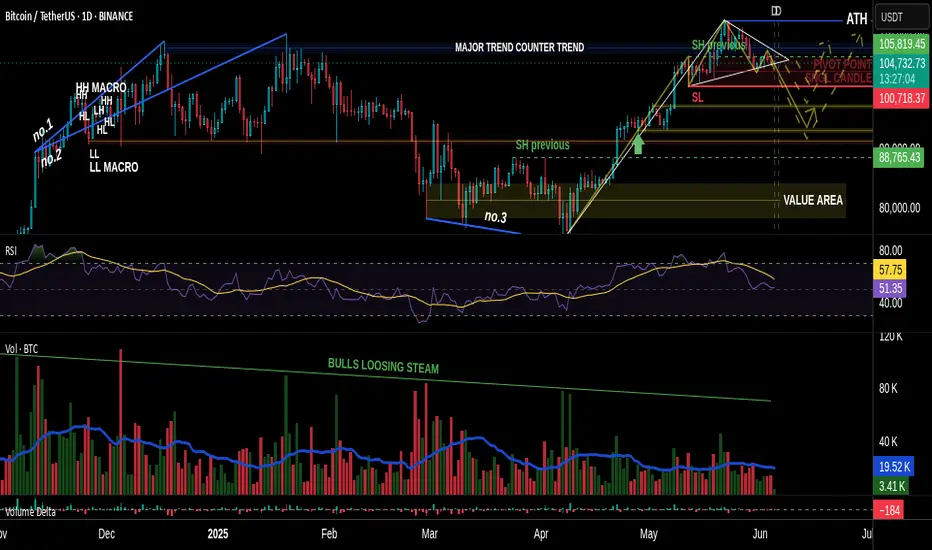
In our current BTC chart, we’re witnessing this contradiction unfold clearly:
• A bullish flag formation...
• Yet within it, the emerging completion of a Head & Shoulders pattern!
How arrogant can the market be! 😄
A moment to laugh—but also a moment to observe how cleverly the crowd is misled.
This is classic manipulation, wrapped in a textbook setup.
But what’s most telling isn’t the pattern on the surface—it’s the volume beneath the structure.
It’s always the quiet details that speak the loudest.
Before price shows its true face, volume often leaves footprints. In our case, those footprints were already leading toward a bearish path—long before the structure began to shape itself clearly.
So while retail eyes focused on the bullish flag, the underlying volume had already begun withdrawing support.
Not aggressively—no. Subtly, almost elegantly, in that familiar way institutions mask intention:
• Spikes that don’t hold
• Buying that doesn’t follow through
• And a steady fade in commitment as price climbs into weakness
It’s in those quiet inconsistencies where VSA earns its value.
It tells us: the move isn’t about what’s obvious.
It’s about what never fully materialized.
So yes, the pattern may still remain incomplete. The Head & Shoulders may yet fail to validate.
But for those who were watching volume first—not structure—the script was already being written.
✒️ From now on, professionally speaking, we must still wait:
• For the Head & Shoulders to confirm or dissolve. So eyes targeted at the swing low level near 107k
• And for volume to either legitimize or invalidate the entire setup
Only then does the chart grant us permission to speak in certainties.
🐾 But so far…
• The clues have favored the bears.
• Sell opportunities appeared early and often—for those who know what to look for.
• Bullish spikes in volume? They were met with silence.
• Momentum fizzled under a macro backdrop of fading demand.
If you were in the right mindset, and aligned even the lower timeframes to basic structural zones,
you already saw the path ahead wasn’t being carved by the bulls.
Let them finish the patterns.
Let the candles paint the story.
But for those trained in volume, the ink has already dried.
And if you're still reading, maybe you already sense it—
real insight doesn’t shout, and it never floats in abundance.
Value has never been about noise. It’s about what’s rare, quiet, and overlooked by the crowd.
Just like in the markets—the true signals aren’t loud, and they’re never free in the economic sense.
Just as price rises where supply thins, the same applies here:
what’s scarce... holds weight.
PS For last A little exercise, something to grasp on. Have you noticed how Volume & RSI behaves in lower time frames? 4Hour or 1Hour for example. Can you identify how volume confirms a bearish move. Do you discover the correct correlation and combined use between VSA & RSI. Remember my previous insight
See you next time!
Most traders fail at one crucial point: they don’t see the market as a living, breathing organism—a structure where one move leads to another, like cause and effect in motion.
That’s what we often call reading the psychology of the market. When you begin to grasp the fundamental principles behind that, you step into the realm of elite traders.
And yes—Volume Spread Analysis (VSA) is a powerful tool, but only if you know how to read it properly.
I’m not a certified trader or financial advisor, and I don’t give signals, entries, or exits. I’m simply a solo observer, sharing a slice of what true technical and fundamental analysis looks like.
And yes—it takes time. It takes skills. Now, if we want to even attempt predicting the future of price action, we must understand something: A chart is not a single truth. It’s a battlefield of conflicting signals.
Patterns, marks, levels—some suggest bullish continuation, others hint at sharp reversals. Confusion is inevitable if you don’t learn to distinguish which signs matter.
In our current BTC chart, we’re witnessing this contradiction unfold clearly:
• A bullish flag formation...
• Yet within it, the emerging completion of a Head & Shoulders pattern!
How arrogant can the market be! 😄
A moment to laugh—but also a moment to observe how cleverly the crowd is misled.
This is classic manipulation, wrapped in a textbook setup.
But what’s most telling isn’t the pattern on the surface—it’s the volume beneath the structure.
It’s always the quiet details that speak the loudest.
Before price shows its true face, volume often leaves footprints. In our case, those footprints were already leading toward a bearish path—long before the structure began to shape itself clearly.
So while retail eyes focused on the bullish flag, the underlying volume had already begun withdrawing support.
Not aggressively—no. Subtly, almost elegantly, in that familiar way institutions mask intention:
• Spikes that don’t hold
• Buying that doesn’t follow through
• And a steady fade in commitment as price climbs into weakness
It’s in those quiet inconsistencies where VSA earns its value.
It tells us: the move isn’t about what’s obvious.
It’s about what never fully materialized.
So yes, the pattern may still remain incomplete. The Head & Shoulders may yet fail to validate.
But for those who were watching volume first—not structure—the script was already being written.
✒️ From now on, professionally speaking, we must still wait:
• For the Head & Shoulders to confirm or dissolve. So eyes targeted at the swing low level near 107k
• And for volume to either legitimize or invalidate the entire setup
Only then does the chart grant us permission to speak in certainties.
🐾 But so far…
• The clues have favored the bears.
• Sell opportunities appeared early and often—for those who know what to look for.
• Bullish spikes in volume? They were met with silence.
• Momentum fizzled under a macro backdrop of fading demand.
If you were in the right mindset, and aligned even the lower timeframes to basic structural zones,
you already saw the path ahead wasn’t being carved by the bulls.
Let them finish the patterns.
Let the candles paint the story.
But for those trained in volume, the ink has already dried.
And if you're still reading, maybe you already sense it—
real insight doesn’t shout, and it never floats in abundance.
Value has never been about noise. It’s about what’s rare, quiet, and overlooked by the crowd.
Just like in the markets—the true signals aren’t loud, and they’re never free in the economic sense.
Just as price rises where supply thins, the same applies here:
what’s scarce... holds weight.
PS For last A little exercise, something to grasp on. Have you noticed how Volume & RSI behaves in lower time frames? 4Hour or 1Hour for example. Can you identify how volume confirms a bearish move. Do you discover the correct correlation and combined use between VSA & RSI. Remember my previous insight
See you next time!
Trade active
Market Update – 13:32 IST (4H & 1H Time Frame)Multiple bearish volume signals have appeared on the 4-hour and 1-hour chart followed by Lower Highs and Lower Lows. At the current level, we’re observing significant exhaustion—and notably, all of this is unfolding within a supply zone.
Now, this is where things get tricky.
A supply zone formed right after a bullish cluster can carry two entirely different implications:
1. Either this exhaustion leads to a short-term retracement,
2. Or there's silent absorption occurring on lower time frames, preparing the ground for another leg higher.
So far, regardless of the volume spike size or behavior from either side, when we compare it with price action, it’s telling us one thing: no one is currently in control.
But I’ve never truly believed that no one is in control. This game is played by bears who become bulls and vice versa—it’s like playing chess against yourself.
The only clue slightly tilting the scale toward one side is the declining bullish volume.
And yes, all of this is happening inside a supply zone. I’m repeating that on purpose—because a supply zone doesn’t always result in a sharp fall, especially when it forms right after a strong bullish cluster. In many cases, that structure actually serves as a continuation pattern.
However, if we get a close below 106.600, and if that close is confirmed by a supporting volume spike, then we can start anticipating a move toward:
• 104.919, or
• At the very least, somewhere between 101.931 and 101.289.
I’m being precise because, as a trader, I like to map out all the potential levels that the big players might be working with. So, to be clear:
These downside levels are only in play if we break below 106.600 with volume support. If not, it could be just another bearish trap.
Related publications
Disclaimer
The information and publications are not meant to be, and do not constitute, financial, investment, trading, or other types of advice or recommendations supplied or endorsed by TradingView. Read more in the Terms of Use.
Related publications
Disclaimer
The information and publications are not meant to be, and do not constitute, financial, investment, trading, or other types of advice or recommendations supplied or endorsed by TradingView. Read more in the Terms of Use.