Hello everyone,
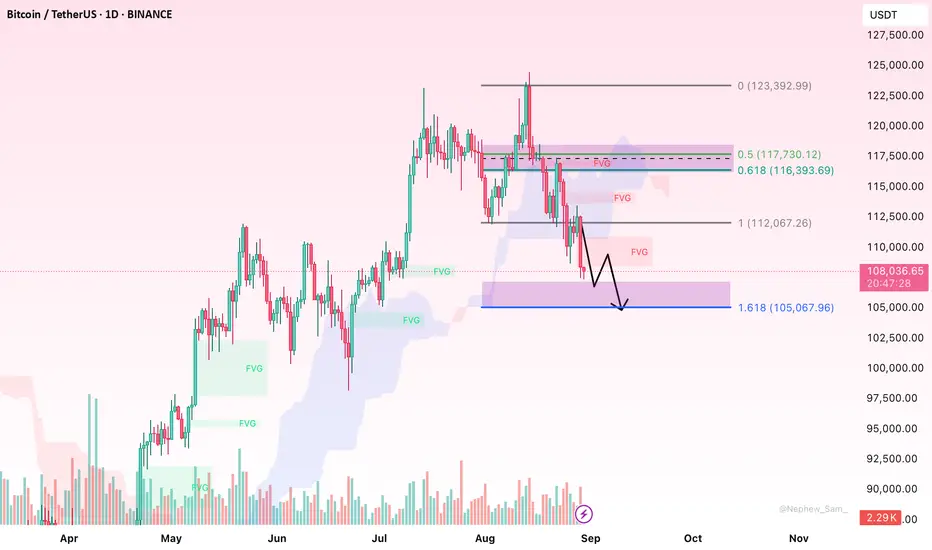
Over the past week, Bitcoin, after failing to break 123K, has clearly shifted into a strong downtrend, forming a continuous series of lower highs and lower lows. The recent drop broke through the 112.1K level—which aligns with the 1.0 Fib of the previous decline—and the price is now trading below all the upper resistance clusters.
From a technical perspective, supply zones and FVGs are exerting significant selling pressure. Specifically, the 116.4K–117.7K area (Fib 0.618–0.5) combined with the previous FVG supply has repeatedly rejected price, while the newly formed 109K–111K zone just below 112.1K could act as a selling area if BTC retraces upward. The layered FVGs above indicate that supply remains thick, emphasizing that any rebound is likely to be capped by selling pressure.
Momentum and candlestick behavior also confirm that sellers are in control. Long red candles, short pullbacks, and lack of volume expansion on upward moves all suggest that buying strength is insufficient to push the price higher. This technical signal reinforces the likelihood that the downtrend will continue.
Regarding targets, the confluence support cluster at 104.8K–105.3K is a reasonable destination for the current decline, aligning with the 1.618 Fib extension and previous demand zones on the chart. If this area breaks, the risk of a deeper drop could extend toward 102.5K–103.0K.
In summary, the downtrend structure is clear, supply and FVGs above are dense, and the path of least resistance remains toward ~105K. Each rebound to the 109K–111K area is likely an opportunity for sellers to reassert control, keeping the bearish trend dominant.
Trade active
Note
The trade is still playing out close to my prediction.Trade like you mean it – because every second matters.
📊 Instant insights.
📬 Precision signals.
👨🏫 Real coaching. Real results.
👉🏻Join here: t.me/+jBAj1Jdf4vY1NzM1
📊 Instant insights.
📬 Precision signals.
👨🏫 Real coaching. Real results.
👉🏻Join here: t.me/+jBAj1Jdf4vY1NzM1
Related publications
Disclaimer
The information and publications are not meant to be, and do not constitute, financial, investment, trading, or other types of advice or recommendations supplied or endorsed by TradingView. Read more in the Terms of Use.
Trade like you mean it – because every second matters.
📊 Instant insights.
📬 Precision signals.
👨🏫 Real coaching. Real results.
👉🏻Join here: t.me/+jBAj1Jdf4vY1NzM1
📊 Instant insights.
📬 Precision signals.
👨🏫 Real coaching. Real results.
👉🏻Join here: t.me/+jBAj1Jdf4vY1NzM1
Related publications
Disclaimer
The information and publications are not meant to be, and do not constitute, financial, investment, trading, or other types of advice or recommendations supplied or endorsed by TradingView. Read more in the Terms of Use.
