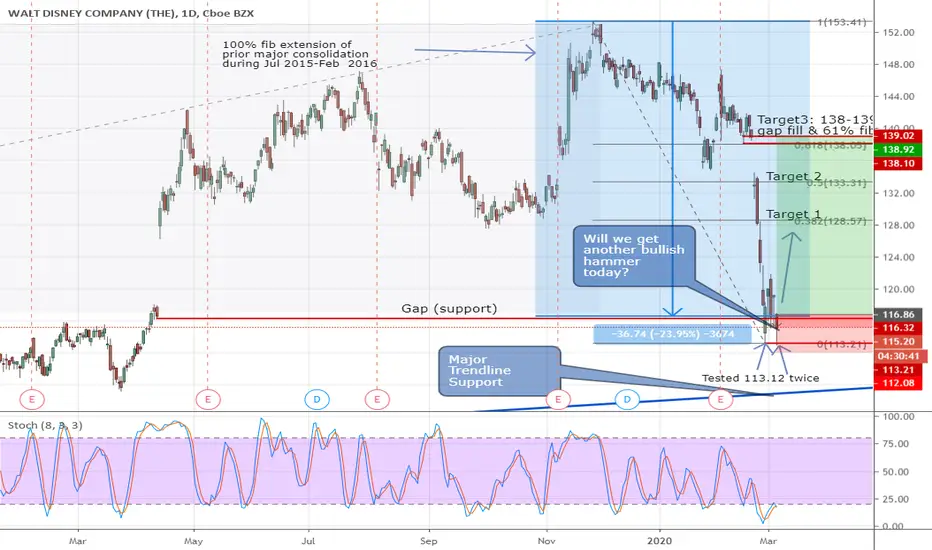
DIS is looking ripe for some swing up. The recent plunge is of a similar magnitude (just a little more than 100% fib extension) of a major prior consolidation that happened between July 2015 - Feb 2016.
The gap was filled at 116.40 on Monday and although it went lower to 113.20, it recovered to close above. At 113.20 (it's lowest point in this plunge), it was just $5 shy of a major trendline support.
Today it retested Monday's low at 113.20 again attempted to bounce from there. I would be interested to go Long if it could close above 116 (thus forming a bullish hammer for today). With a Stop just below 13.0 and looking to scale out as it reaches each target up.
Disclaimer
The information and publications are not meant to be, and do not constitute, financial, investment, trading, or other types of advice or recommendations supplied or endorsed by TradingView. Read more in the Terms of Use.
Disclaimer
The information and publications are not meant to be, and do not constitute, financial, investment, trading, or other types of advice or recommendations supplied or endorsed by TradingView. Read more in the Terms of Use.