📊 DRREDDY – Falling Wedge Breakout Analysis
Date: August 2, 2025
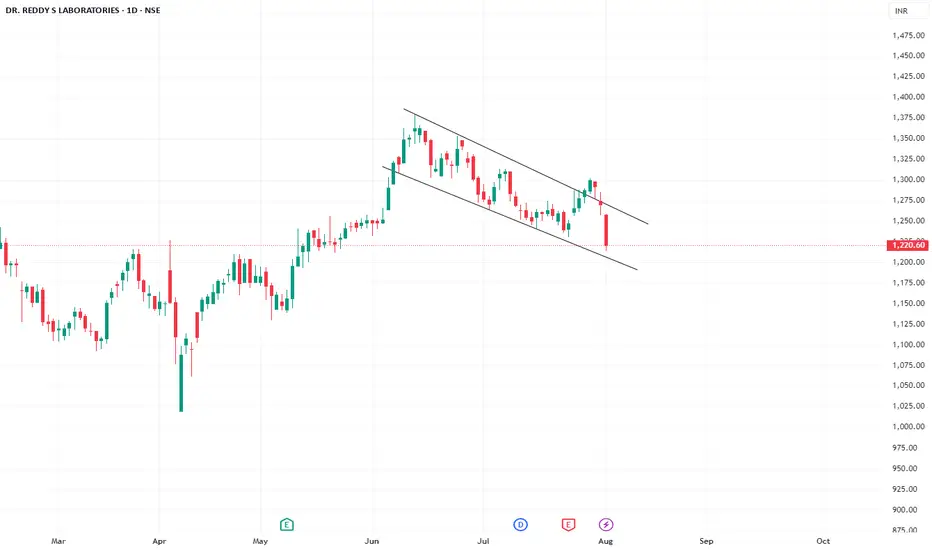
CMP (Current Market Price): ₹1,220.60 ( Look for Support or breakdown on trend lines )
📝 Summary:
Dr. Reddy’s Laboratories has broken out of a falling wedge pattern on the daily chart, a classic bullish reversal setup. After weeks of narrowing price action between converging trendlines, the breakout happened with decent volume. This structure generally suggests a potential short-to-medium term upmove, especially if the breakout/breakdown is followed by a retest.
But has entered in the wedge again with a strong bearish candle , so lets respect the trend lines and plan a course of action!
📉 Technical Breakdown:
Price moved within a falling wedge between ~₹1,300 and ~₹1,170 since late June.
The wedge formed over ~30 trading sessions, respecting the upper and lower trendlines.
A breakout occurred near ₹1,225 with a strong bullish candle, closing above the upper trendline.
Volume expanded during breakout, indicating buyer interest.
RSI has turned upward from the 40–45 zone; MACD shows signs of a crossover.
🔑 Key Price Levels:
Type Level (₹)
Retest Zone 1,202 – 1,210
Immediate Resistance 1,240 – 1,245
Volume confirmation is key — look for above-average green candles.
Monitor Nifty Pharma index as a sectoral tailwind may accelerate moves.
Date: August 2, 2025
CMP (Current Market Price): ₹1,220.60 ( Look for Support or breakdown on trend lines )
📝 Summary:
Dr. Reddy’s Laboratories has broken out of a falling wedge pattern on the daily chart, a classic bullish reversal setup. After weeks of narrowing price action between converging trendlines, the breakout happened with decent volume. This structure generally suggests a potential short-to-medium term upmove, especially if the breakout/breakdown is followed by a retest.
But has entered in the wedge again with a strong bearish candle , so lets respect the trend lines and plan a course of action!
📉 Technical Breakdown:
Price moved within a falling wedge between ~₹1,300 and ~₹1,170 since late June.
The wedge formed over ~30 trading sessions, respecting the upper and lower trendlines.
A breakout occurred near ₹1,225 with a strong bullish candle, closing above the upper trendline.
Volume expanded during breakout, indicating buyer interest.
RSI has turned upward from the 40–45 zone; MACD shows signs of a crossover.
🔑 Key Price Levels:
Type Level (₹)
Retest Zone 1,202 – 1,210
Immediate Resistance 1,240 – 1,245
Volume confirmation is key — look for above-average green candles.
Monitor Nifty Pharma index as a sectoral tailwind may accelerate moves.
Disclaimer
The information and publications are not meant to be, and do not constitute, financial, investment, trading, or other types of advice or recommendations supplied or endorsed by TradingView. Read more in the Terms of Use.
Disclaimer
The information and publications are not meant to be, and do not constitute, financial, investment, trading, or other types of advice or recommendations supplied or endorsed by TradingView. Read more in the Terms of Use.