🔎 Chart Context
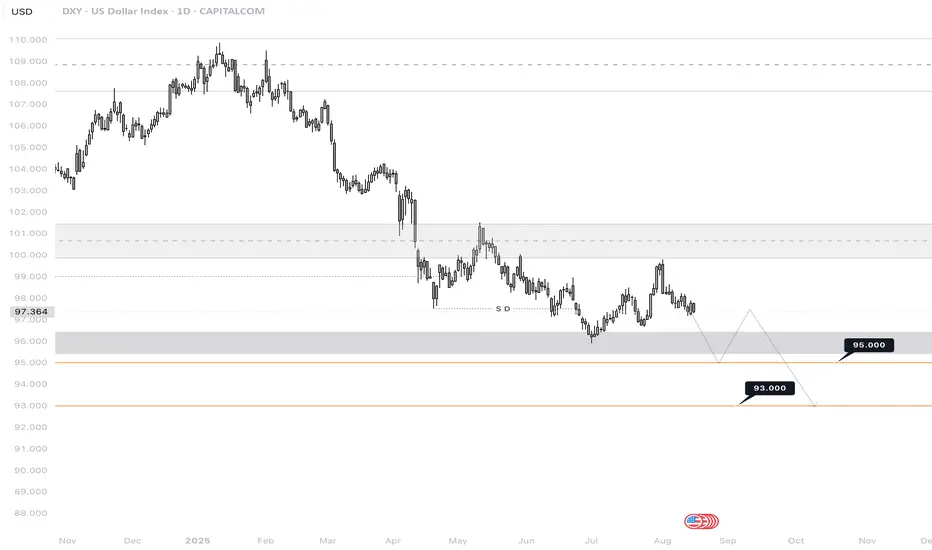
• Instrument: DXY (US Dollar Index)
• Timeframe: 1D (Daily)
• Broker: Capital.com
• Date: 15 August 2025
This chart tracks the relative strength of the US Dollar against a basket of major currencies. It is also strongly correlated inversely with risk assets (BTC, SOL, equities, gold).
📊 Key Observations
1. Macro Structure
• DXY peaked at 109.879 and 109.506 (late 2024 highs).
• Since then, the index has been in a steady downtrend, forming consistent lower highs: 107.235 → 104.256 → 101.513 → 98.959.
• Current price trades around 97.805–98.268, well below prior supports, confirming bearish pressure.
2. Support & Demand Zones
• 97.527 – 96.663: Current support range being tested repeatedly.
• 95.000: Stronger demand zone, marked as the next probable retest.
• 93.000: A deeper liquidity level, identified as a potential long-term downside target.
3. Resistance Zones
• 98.959 – 99.804: Previous breakdown area and strong supply.
• Any bullish bounce will likely stall in this zone unless momentum shifts drastically.
4. Liquidity Behavior
• DXY is compressing within the 97.5–99 band.
• Multiple sweeps of 97.527–96.663 suggest buyers are weakening.
• Next liquidity magnet lies at 95.000, with potential extension to 93.000.
5. Projected Path
• The chart projection suggests further downside movement toward 95.000, followed by a temporary relief rally, then continuation toward 93.000.
• This aligns with a macro bearish USD outlook.
📈 Bullish Case (Low Probability, Countertrend)
• If DXY holds 97.527–96.663 strongly and forms a higher low:
• First target: 98.959 (minor resistance)
• Second target: 99.804 (supply zone)
• Sustained break above 101.513 would change trend bias to bullish.
• However, this requires a major macro catalyst (e.g., Fed tightening or risk-off flows).
📉 Bearish Case (Higher Probability, Dominant Scenario)
• Downtrend structure intact with clear lower highs.
• Current weakness signals continuation:
• Next stop: 95.000 liquidity zone.
• Final target: 93.000 if bearish momentum persists.
• This aligns with weakening dollar demand and capital rotation into risk assets (crypto, equities, commodities).
⚡ Trading Plan
• Short Bias (Preferred Play):
• Enter on relief rallies into 98.959–99.804 supply zone.
• Target 1: 95.000
• Target 2: 93.000
• Stop-loss: Above 101.513
• Long Setup (Countertrend, Risky):
• Enter at 95.000 demand zone (scalp long).
• TP1: 98.959
• Stop: Below 93.000
Disclaimer
The information and publications are not meant to be, and do not constitute, financial, investment, trading, or other types of advice or recommendations supplied or endorsed by TradingView. Read more in the Terms of Use.
Disclaimer
The information and publications are not meant to be, and do not constitute, financial, investment, trading, or other types of advice or recommendations supplied or endorsed by TradingView. Read more in the Terms of Use.